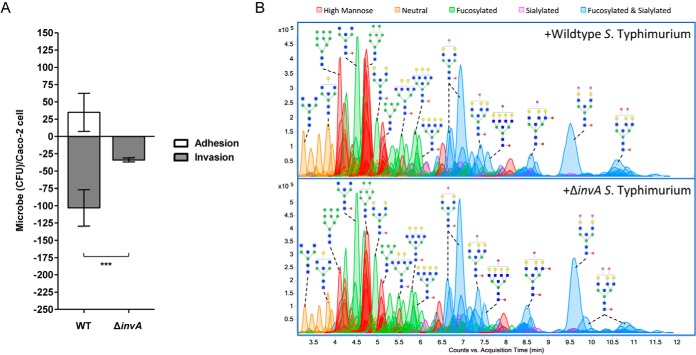
Fig. 4.
Infection of Caco-2 with ΔinvA S. typhimurium. A, Comparison of the CFU of wildtype and mutant S. typhimurium that adhered (white bars) and invaded (gray bars) per Caco-2 cell. Error bars show S.E. between 3 biological replicates. Astericks indicate statistical significance, where ***, p < 0.001. B, Chromatograms of identified glycan compounds on Caco-2 after co-incubation with WT and ΔinvA S. typhimurium. Abundant peaks are annotated with putative structures. Symbol nomenclature is used for representing glycan structures (52).

