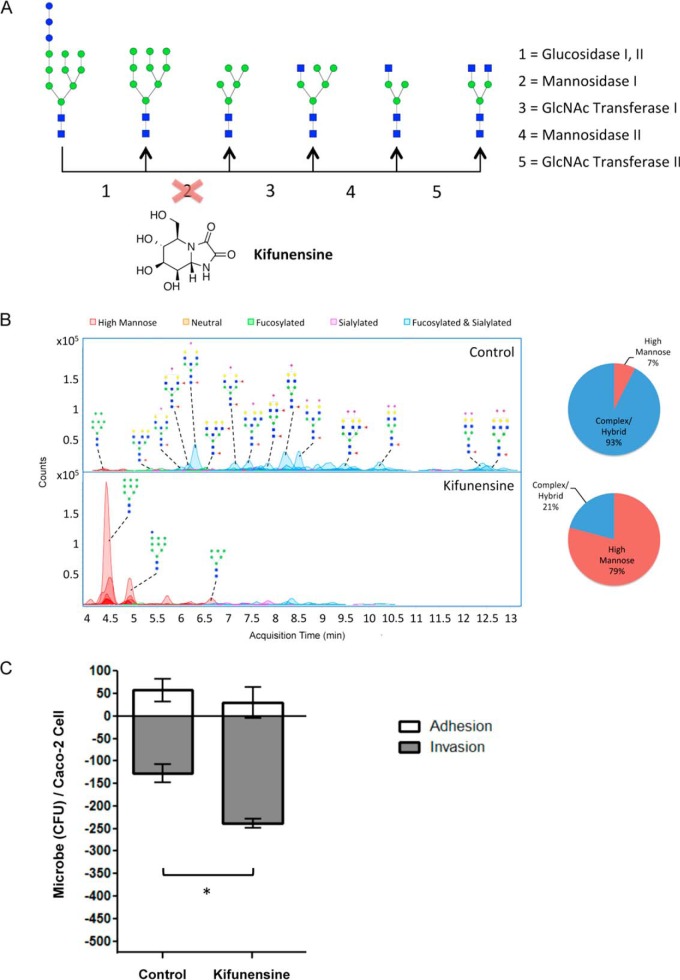
Fig. 5.
Effects of kifunensine treatment on cell surface glycosylation and bacterial infection. A, Kifunensine inhibits the mannosidase I enzyme that participates in N-glycan biosynthesis. B, Chromatograms display each compound at its column retention time. Pie charts show the summed abundances of high mannose and complex/hybrid type glycans before and after treatment. C, S. typhimurium adhesion (white bars) and invasion (gray bars) plot of untreated versus kifunensine-treated Caco-2 cells. S.E. is represented by error bars (n = 3). Astericks indicate statistical significance, where *, p < 0.05. Symbol nomenclature is used for representing glycan structures (52).

