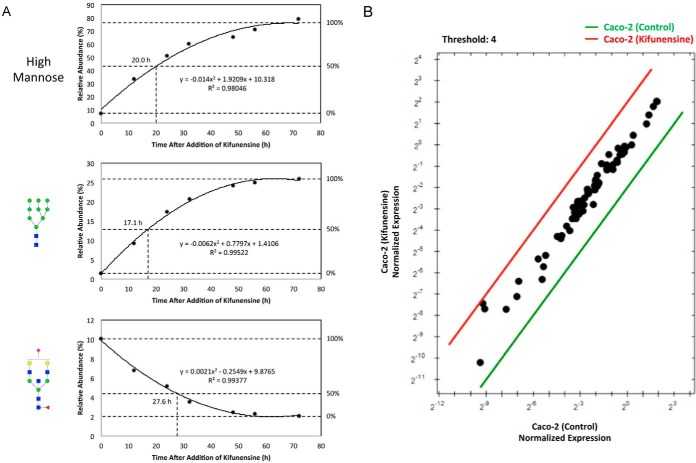
Fig. 6.
Changes in glycan expression over time after addition of kifunensine. A, Rate lines are interpolated based on the average abundances of high mannose, Man 9, and Hex5HexNAc5Fuc1NeuAc1 following kifunensine treatment. B, Expression level comparison of total RNA extracted from untreated and kifunensine-treated cells. Data are shown as fold changes relative to reference genes. Symbol nomenclature is used for representing glycan structures (52).

