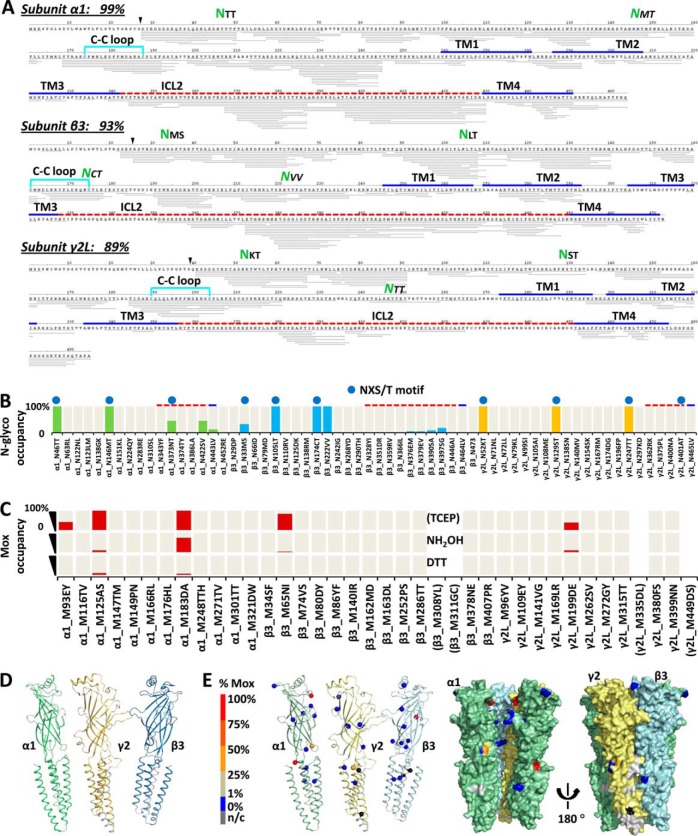
Fig. 4.
Artifact/bias-minimal FDD enabled comprehensive profiling of GABAAR PTMs with % site occupancy: N-glycosylation and endogenous M-oxidation. A, Representative peptide sequence coverage map of GABAAR acquired from one run (Expt. 6 in Fig. 2A) at peptide FDR<1% by PD 1.3 SEQUEST. Each thin line represents one unique peptide ion (modified versions combined). % coverage excluded expected signaling sequences. Green NXX highlights identified ECD N-glyco sites. Key domains were located by sequence alignment with C. elegans GluCl (3RHW) (8) (Methods and supplemental Fig. S5). B, Complete inventory of N-glyco % site occupancy. Top blue dot designates canonical NX(!P)S/T motif. Green, blue, and yellow bars, N-glyco % occupancy for α1, β3, and γ2 subunits, respectively; cream bars in background, N sites covered in PD1.4 quantitation. C, Inventory of Mox % site occupancy (red bar) using TCEP, TCEP+NH2OH, or TCEP+DTT for peptide reduction (Expt. 4, 6, and 5 in Fig. 2A respectively). Cream bars in background, covered in PD1.4 quantitation; brackets, not covered. D, Sequence coverage used for quantitation mapped to 3RHW-based 3D structures (Expt. 4–6 combined search at peptide FDR<1% by PD1.4 SEQUEST-HT). Green, α1; blue, β3; orange, γ2; silver, n/c, not covered; ICD was not shown. E, Endogenous Mox % site occupancy (sphere) by FDD-TCEP mapped to 3D models of individual α1, γ2, and β3 subunit (cartoon), and whole complex (surface). One β3 subunit was removed from the pentamer to show inner surface. N-glyco and Mox % occupancies were quantified by summing MS isotopic peak areas extracted at 2 ppm mass precision of the unmodified and modified version of the same peptide sequences: %(D/(N+D)), and %(Mox/(M+Mox)), respectively (Methods).

