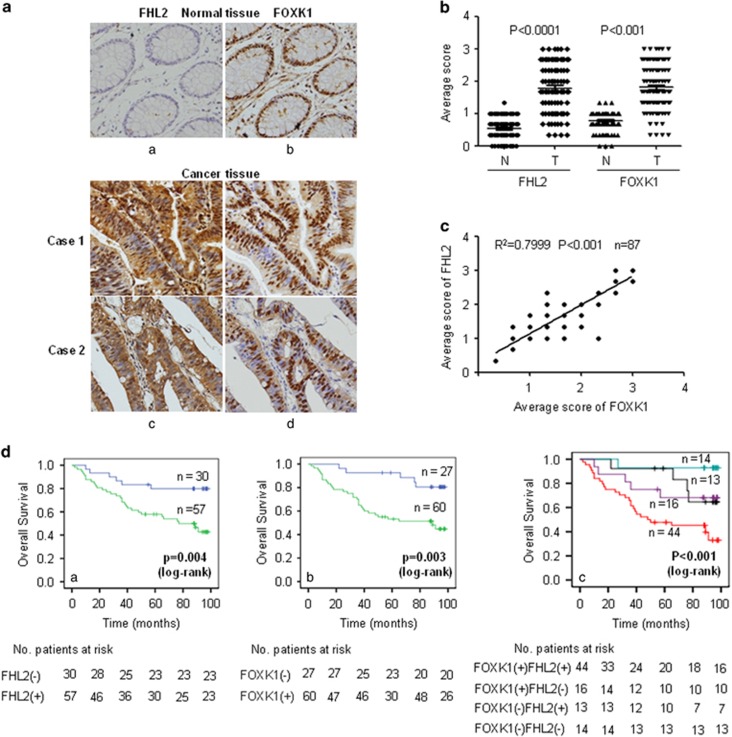
Figure 3.
Positive correlation between FHL2 and FOXK1 expression in CRC. (a) FHL2 (a and c) and FOXK1 (b and d) expression in normal or cancerous colorectal tissue specimens were detected by IHC assays. These figures were the representatives of colorectal tissues from 87 cancerous and non-cancerous patients. Normal mouse IgG was used as the isotype control for the first antibody (a and b). (b) Average scores of the two proteins in normal and cancerous CRC tissues. ****P<0.001 between normal and cancer tissues. (c) FHL2 and FOXK1-positive staining were quantified and a Spearman correlation was performed. ****P<0.001. (d) Kaplan–Meier overall survival analysis of CRC patients. Survival analysis was performed according to the expression status of FHL2 (a), FOXK1 (b) and the combined expression status of FHL2 and FOXK1 (c), respectively. Scale bars represent 100 μm in a.

