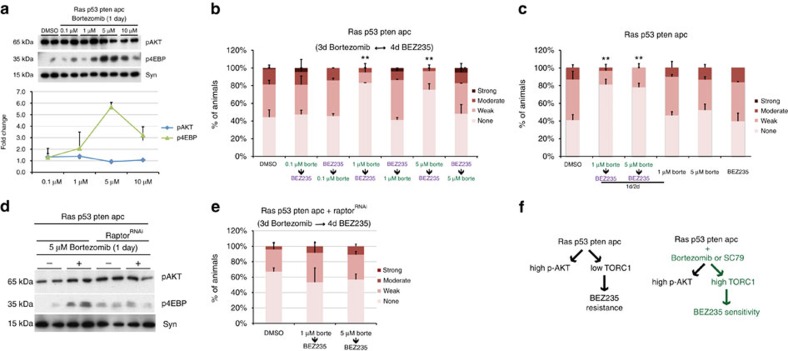
Figure 8. Bortezomib promotes sensitivity to PI3K pathway inhibition.
(a) Western blot analysis of PI3K pathway activity in rasG12V p53Ri ptenRi apcRi hindguts after 1 day feeding of bortezomib at indicated doses. Each data point represents the average response of two to five biological replicates with ten hindguts per replicate. Error bars: s.e.m. (b) Quantification of dissemination in rasG12V p53Ri ptenRi apcRi animals after sequential treatment with BEZ235 and indicated doses of bortezomib. (c) Quantification of dissemination in rasG12V p53Ri ptenRi apcRi animals after a 1-day/2-day alternating treatment schedule of bortezomib/BEZ235 and each drug alone. (d) Western blot analysis of PI3K pathway activity in rasG12V p53Ri ptenRi apcRi hindguts with and without raptor knockdown treated with 5 μm bortezomib for 1 day. (e) Quantification of dissemination in rasG12V p53Ri ptenRi apcRi raptorRi animals after sequential treatment with indicated doses of bortezomib followed by BEZ235. (f) Schematic illustration of the mechanism by which the two-step therapy overcomes resistance to BEZ235: elevating mTORC1 activity increases subsequent sensitivity to BEZ235. (b,c,e) n=2 replicates, 30 flies per replicate; error bars: s.e.m. *P<0.01 and **P<0.05 (Fisher's exact test). Drug doses reflect concentrations in the food. Uncropped gels used to generate panels a and d can be found in Supplementary Fig. 8e,f.

