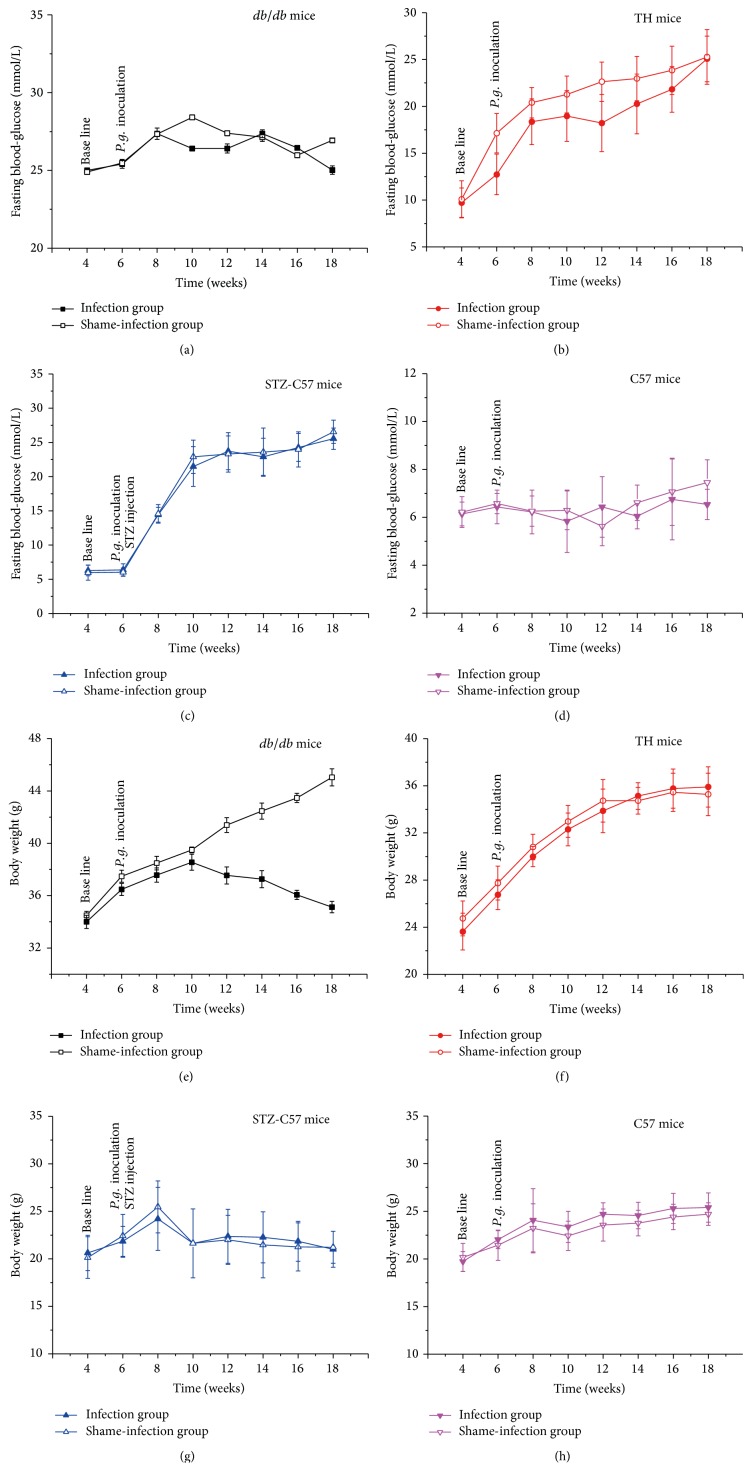
Figure 2.
Comparison of fasting blood glucose and body weight levels in different mice: (a, e) db/db mice; (b, f) TH mice; (c, g) STZ-C57 mice; (d, h) C57 mice. No statistical difference (P > 0.05) detected for the fasting glucose levels between infection and shame-infection groups in four types of mice. At sacrifice the body weights of infected db/db were significantly higher than their controls (P < 0.01). No significant difference was found in the body weight between infection and shame-infection groups in TH, STZ-C57, and C57 mice. Values for each time point are expressed as mean ± SEM.

