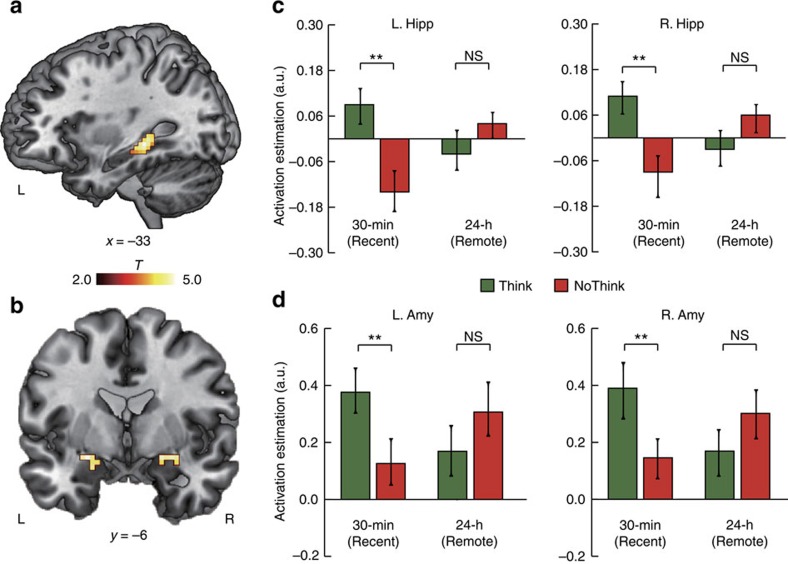
Figure 3. Brain systems underlying memory suppression.
(a) Sagittal view of significant clusters in the left hippocampus (MNI, peak at −33, −33 and −6), and (b) Coronal view of significant clusters in the left (MNI, peak at −24, 0 and −12) and right amygdala (MNI, peak at 21, 0 and −12) showing interaction effects between Suppression and Time (T_30 min—NT_30 min>T_24 h—NT_24 h). (c,d) Bar graphs represent functional activation in the hippocampus and amygdala. Each bar graph was plotted against the fixation period in the Think/NoThink task. Colour bar represents T values and error bars represent standard error of mean (s.e.m.). *P<0.05; **P<0.01; Amy, amygdala; Hipp, hippocampus; L, left; MNI, Montreal Neurological Institute coordinate system; R, right.

