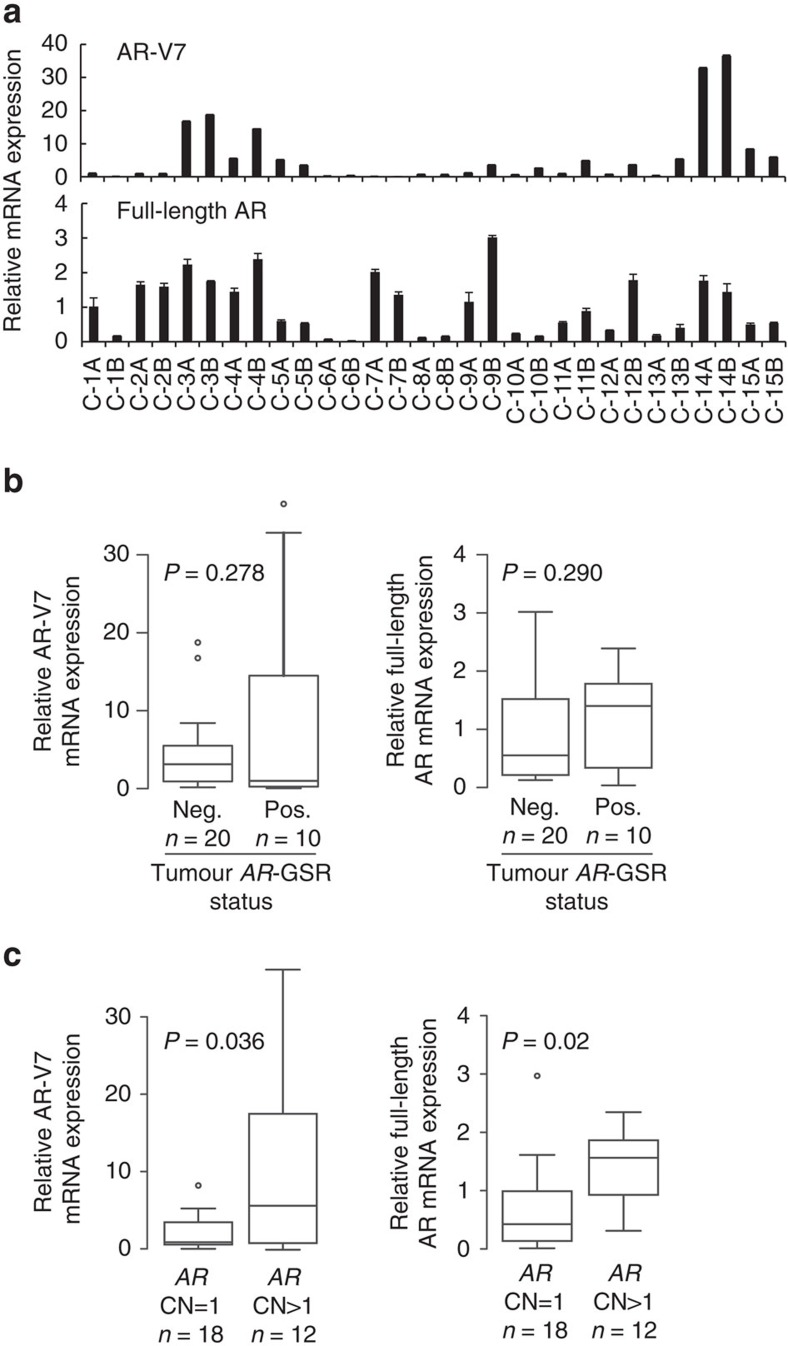
Figure 2. Association of AR-V7 mRNA expression levels with AR gene copy number.
(a) mRNA expression of AR-V7 (top) and full-length AR (bottom) was assessed by quantitative RT–PCR. Levels are shown relative to a housekeeping gene (RPL13A), with expression in tumour C-1A set to 1. Data represent mean±s.d. from three repeated experiments each consisting of independent RT and PCR reactions from the same original RNA sample (n=3). Relative mRNA expression levels of AR-V7 (left) or full-length AR (right) were compared in tumours that (b) were positive (Pos.) or negative (Neg.) for an AR gene structural rearrangement (AR-GSR) event or (c) had AR gene copy number (CN) ≥1. Centre lines show the medians; box limits indicate the 25th and 75th percentiles; whiskers extend 1.5 times the interquartile range from the 25th and 75th percentiles and outliers are represented by dots. P-values were determined by one-tailed Mann–Whitney U-test.

