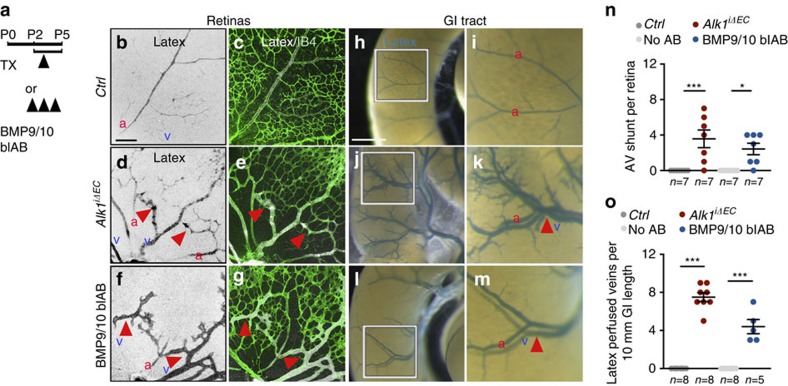
Figure 1. Blocking BMP9/10-Alk1 signalling induces vascular malformations.
(a) Schematic representation of the experimental strategy used to delete Alk1 or to block BMP9/10 ligands (P0–P5). Arrowheads indicate intra-gastric injection of 50 μg Tx at postnatal day 3 (P3) and i.p. administration of BMP9/10 blAB, (10 mg kg−1) at P2–P4. (b–g) P5 mouse retinas containing latex dye injected into the left ventricle of the heart. Vascular staining with latex dye (black in single images in b,d,f and white in merged images in c,e,g) and IB4, (green) in c,e,g of retinal flat mounts from control (Ctrl) (b,c), Alk1iΔEC (d,e) and BMP9/10 blAB-injected (f,g) mice. Red arrowheads indicate retinal AVMs. (h–m) Vascular staining with latex dye of small intestine (blue) in Ctrl (h,i), Alk1iΔEC (j,k) and BMP9/10 blAB-injected (l,m) P5 mice. i,k,m are magnified areas of boxed areas in h,j,l. Red arrowheads indicate latex-perfused veins. (n) Quantification of AV shunt number in the retinas. Each dot represents a retina. n=7 Retinas per group. Error bars: s.e.m., *P<0.05 and ***P<0.001, Mann–Whitney U-test. (o) Quantification of latex-perfused veins at the surface of the small intestine. Each dot represents a perfused vein. n=5–8 intestines. Error bars: s.e.m., ***P<0.001, Mann–Whitney U-test. Scale bars, 100 μm in b–g and 10 mm in h,j,l. a, artery in red; v, vein in blue.

