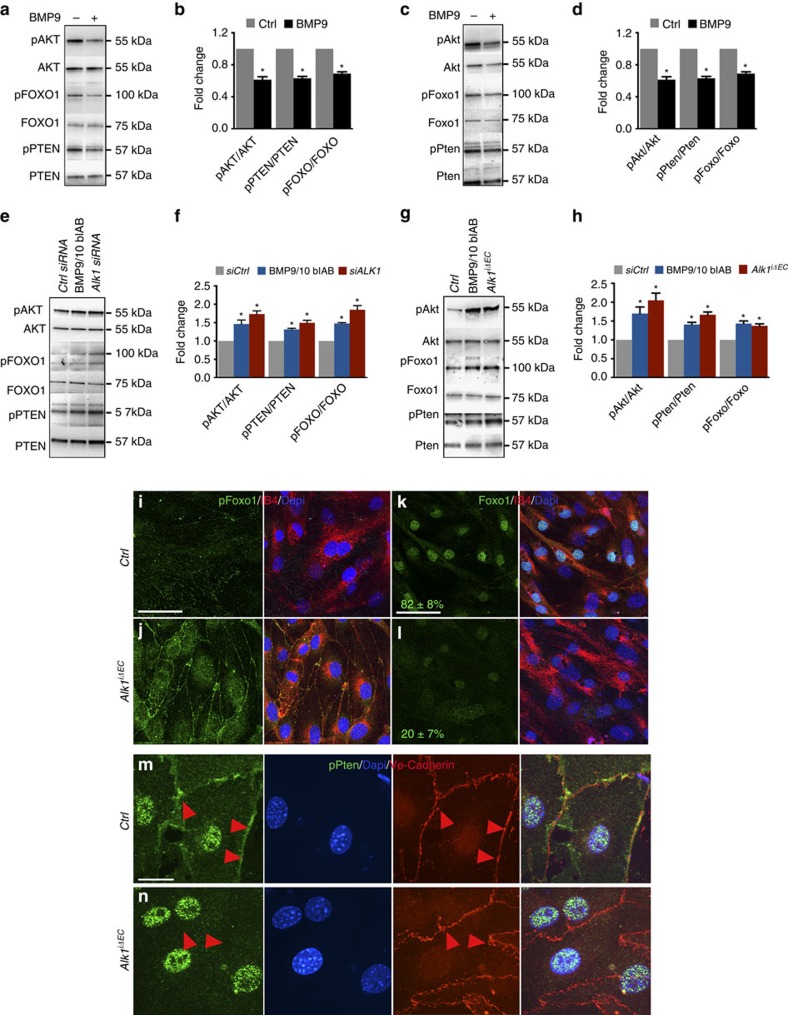
Figure 3. Alk1 deletion increases PI3K signalling.
(a,c) Western blot (Wb) analysis of HUVECs (a) and mLECs (c) stimulated or not with BMP9 for 2 h. (b,d) Quantifications of HUVECs (b) and mLECs (d) pAKT, pPTEN and pFOXO1 levels normalized to total AKT, PTEN and FOXO1, respectively. (e) Wb analysis of HUVECs transfected with Ctrl or ALK1 siRNA or treated with 1 μg ml−1 of BMP9/10 blAB for 36 h. (f) Quantifications of pAKT, pPTEN and pFOXO1 levels normalized to total AKT, PTEN and FOXO1, respectively. (g) Wb analysis of mLECs with the indicated genotype or treated with 1 μg ml−1 of BMP9/10 blAB for 36 h. (h) Quantifications of pAkt, pFoxo1 and pPten levels normalized to total Akt, Foxo1 and Pten, respectively. Graphs represent mean of n=4 experiments. Error bars: s.e.m., *P<0.05, Student's T-test. (i,j), pFoxo1 (green), IB4 (red) and Dapi (blue) staining of Ctrl (i) and Alk1iΔEC (j) mLECs in culture. (k,l) Foxo1 (green), IB4 (red) and Dapi (blue) staining for Ctrl (k) or Alk1iΔEC (l) mLECs. Numbers represent percentage of cells with nuclear Foxo1 staining. (m,n) Anti-pPten (green), Dapi (blue) and Ve-Cadherin (red) staining for Ctrl (m) and Alk1iΔEC (n) mLECs in culture. Red arrowheads indicate pPten expression at plasma membrane. Scale bars, 100 μm in i–l and 10 μm in m,n.

