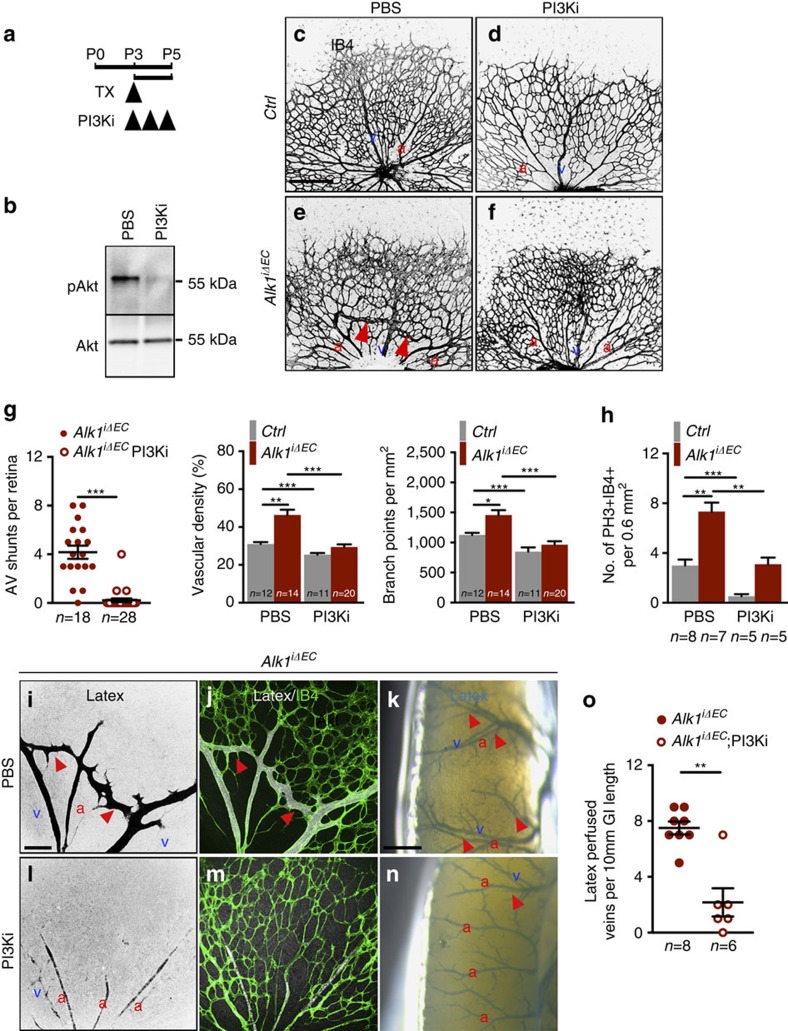
Figure 4. PI3K inhibition prevents vascular defects in Alk1iΔEC mice.
(a) Schematic representation of the experimental strategy to assess the effects of PI3K inhibition on Alk1iΔEC vasculature. Arrowheads indicate the time course of Tx (50 μg) and Wortmannin (PI3Ki, 0.4 mg kg−1) or PBS (vehicle) administration. (b) Western blot analysis of Akt activation (pAkt) in total lung lysates from PBS or PI3K inhibitor-treated wild-type mice. (c–f) IB4 staining of retinal flat mounts (negative images of the fluorescent signal) from Ctrl (c,d) and Alk1iΔEC P5 mice (e,f) injected with vehicle (c,e) or PI3Ki (d,f). Red arrowheads indicate AV shunts. (g) Quantification of the AV shunt number, vascular density and number of branchpoints. Each dot represents one retina. n=11–28 retinas per group. Error bars: s.e.m., *P<0.05, **P<0.01 and ***P<0.001, Mann–Whitney U-test. (h) Quantification of PH3+, IB4+ endothelial cells of P5 retinas harvested from mice with the indicated genotypes treated with PBS or PI3Ki. n=5–8 retinas per group. Error bars: s.e.m., **P<0.01 and ***P<0.001, Mann–Whitney U-test. (i,j,l,m) Vascular staining with latex dye (black in single images in i,l and white in merged images in j,m) and IB4 (green) of retinal flat mounts from Alk1iΔEC P5 mice treated with PBS (i,j) or PI3Ki (l,m). (k,n) Vascular staining of the small intestine surface (blue) of Alk1iΔEC treated with PBS (k) or PI3Ki (n) P5 mice. Red arrowheads in i–k,n indicate latex-perfused veins. (o) Quantification of latex-perfused veins. Each dot represents one intestine. n=6–8 Intestines per group. Error bars: s.e.m., **P<0.01, Mann–Whitney U-test. Scale bars, 200 μm in c–f, 100 μm in i,l and 500 μm in k,n. a, artery in red; v, vein in blue.

