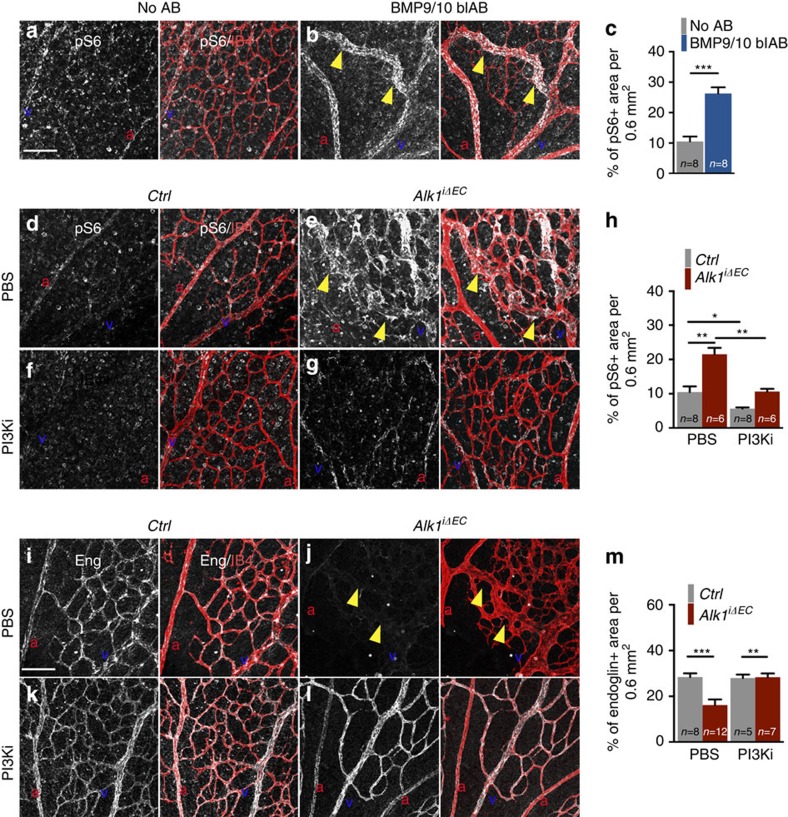
Figure 6. PI3K inhibition rescues downstream signalling components.
(a,b) Anti phospho-S6 (pS6) and IB4 staining of retinal flat mounts from P5 mice treated or not with BMP9/10 blAB. (c) Quantification of the percentage of pS6+ vascular area per field of view. n=8 Retinas per group. Error bars: s.e.m., ***P<0.001, Mann–Whitney U-test. (d–g) Anti-pS6 and IB4 staining of retinal flat mounts from Ctrl (d,f) or Alk1iΔEC (e,g) treated with PBS (d,e) or PI3Ki (f,g). (h) Quantification of the percentage of pS6+ vascular area per field of view. n=6–8 Retinas per group. Error bars: s.e.m., *P<0.05 and **P<0.01, Mann–Whitney U-test. (i,l) Anti-Eng and IB4 staining of retinal flat mounts from Ctrl (i,k) or Alk1iΔEC (j,l) treated with PBS (i,j) or PI3Ki (k,l). (m) Quantification of the percentage of Eng+ vascular area per field of view. Yellow arrowheads in b,e,j indicate AV shunts. n=5–12 Retinas per group. Error bars: s.e.m., **P<0.01 and ***P<0.001, Mann–Whitney U-test. Scale bars, 100 μm in a,b,d–g,i–l. a, artery in red; v, vein in blue.

