Figure 2.
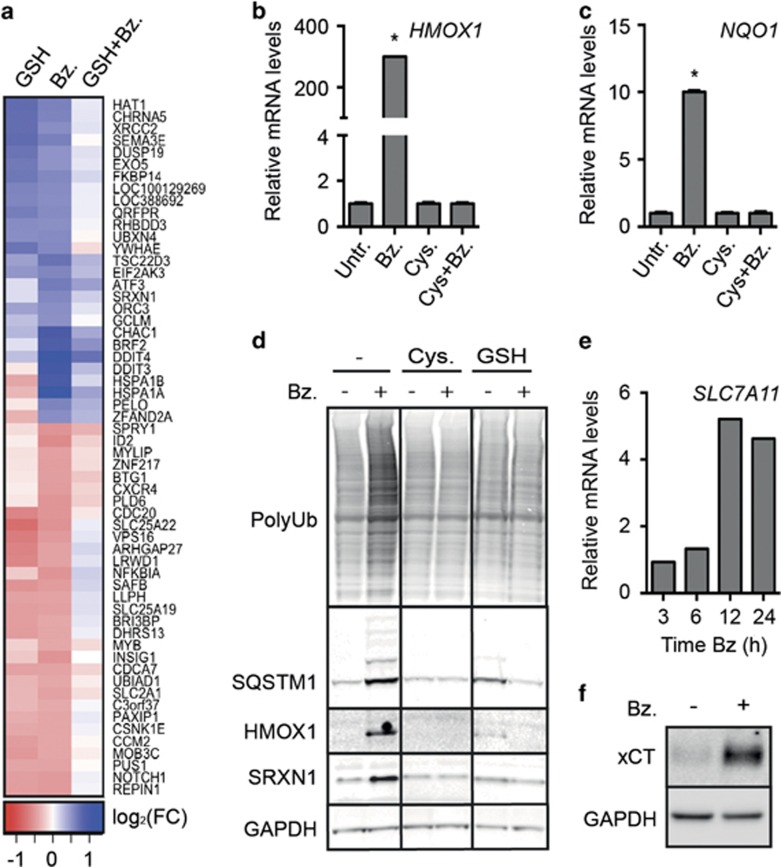
Cysteine and GSH attenuated bortezomib-induced transcriptional changes, protein ubiquitination and upregulation of redox-defense proteins. (a) INA-6 cells were grown in RPMI, diluted to 50% in HBSS and treated with 4 nm bortezomib (Bz), 1 mm GSH, or a combination of bortezomib and GSH for 4 h. RNA was collected and analyzed by Illumina Gene Expression assay. The heatmap displays genes differentially expressed after bortezomib treatment, and dampened by the combination (bz/DMSO<0.05 and bz/bz+GSH<0.05). The heatmap was generated from log FC ratios, with a ratio cutoff of >0.5 (upregulated genes) or >0.4 (downregulated genes) (see Supplementary Table S1). The experiment was performed in triplicates. (b, c) INA-6 cells were treated with 4 nm bortezomib with or without 1 mm cysteine (Cys) supplement for 4 h. RNA was collected and analyzed for mRNA levels of HMOX1 (b) or NQO1 (c) by qPCR. Data are mean and s.d. for triplicates in one representative experiment of at least three independent experiments. Asterisks indicate statistically significant changes compared with the control (two-way ANOVA, Turkey's multiple comparisons test, P<0.05). (d) INA-6 cells were treated for 24 h with 4 nm bortezomib in the presence of 1 mm cysteine or GSH. Cells were lysed and protein levels were analyzed by immunoblotting, as indicated. GAPDH was used as a loading control. (e) INA-6 cells were treated with 5 nm bortezomib for the indicated time points. RNA was collected and analyzed for mRNA levels of SLC7A11 by qPCR. (f) INA-6 cells were treated with 4 nm bortezomib for 24 h. Cells were lysed and xCT protein levels were analyzed by immunoblotting. GAPDH was used as a loading control. Data are representative for at least three independent experiments (d–f).

