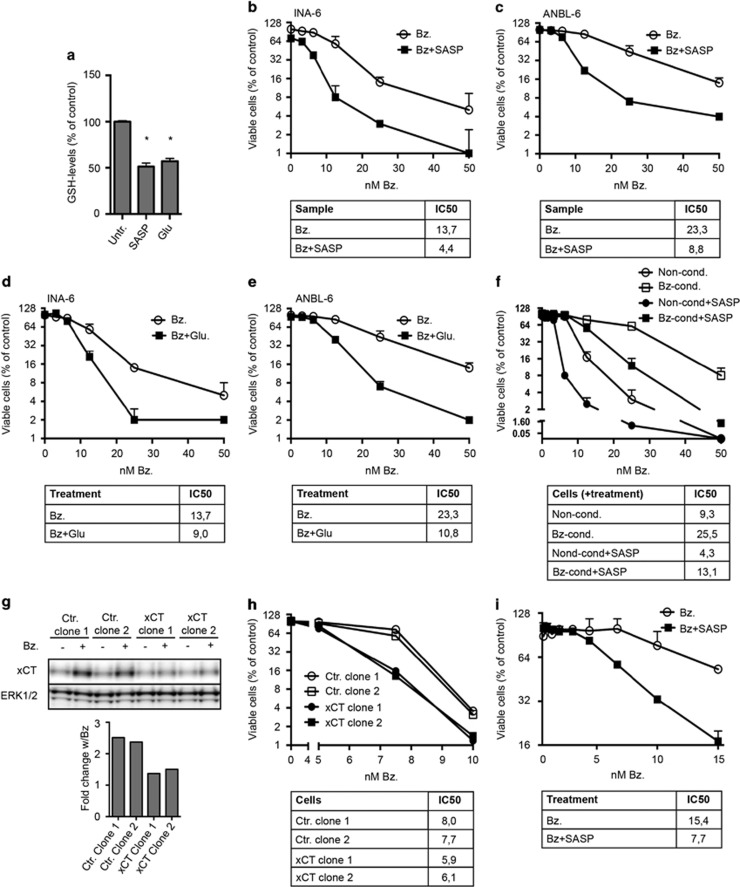
Figure 4.
Inhibiting Xc- activity reduced intracellular GSH levels and potentiated bortezomib-induced cytotoxicity in myeloma cell lines and primary cells. (a) ANBL-6 cells were treated with 0.25 mm sulfasalazine (SASP) or 5 mm glutamate (Glu) for 16 h. Intracellular GSH was measured as described in Materials and methods. Data are mean and s.d. from triplicates of one representative of three independent experiments. Asterisk indicates statistically significant differences as compared with the control (two-way ANOVA, Turkey's multiple comparisons test, P<0.05). INA-6 (b) or ANBL-6 cells (c) were treated with the indicated doses of bortezomib (Bz) alone or in combination with 0.25 mm sulfasalazine for 24 h. Sulfasalazine treatment induced a significant decrease in the IC50 of bortezomib. INA-6 (d) or ANBL-6 cells (e) were treated with the indicated doses of bortezomib and 5 mm glutamate for 24 h. Glutamate treatment induced a significant decrease in IC50 of bortezomib. (f) Bortezomib-conditioned (Bz-cond.) and non-conditioned (Non-cond.) INA-6 cells were treated and analyzed as in (b). Sulfasalazine treatment induced a significant decrease in IC50 of bortezomib in both conditioned and non-conditioned cells. (g) SLC7A11 was targeted in INA-6 cells using CRISPR/Cas9. Clones were lysed and xCT levels were determined by immunoblotting. Bars give the quantified bortezomib-induced change of xCT levels. ERK1/2 was used as a loading control as GAPDH levels were reduced in xCT clones. Data are representative of at least three independent experiments. (h) Clones from (g) were treated with the indicated doses of bortezomib and 0.25 mm sulfasalazine for 24 h. Bortezomib displayed a significantly lower IC50 in xCT knockdown clones than in non-targeting control clones. (i) CD138+ plasma cells from a myeloma patient were treated for 3 days with bortezomib alone or in combination with 0.25 mm sulfasalazine. Sulfasalazine treatment induced a significant decrease in IC50 of bortezomib. The ScanR microscope was used to measure cell death. All IC50 values are in nm, and were calculated using non-linear regression. Extra sum-of-squares F-test was used to test for significant shifts in IC50 (P<0.05). (b–f) and (h) Mean and standard deviation from duplicates in one representative experiment of at least three independent experiments is shown. (i) Mean and standard deviation from duplicates in one experiment is shown.

