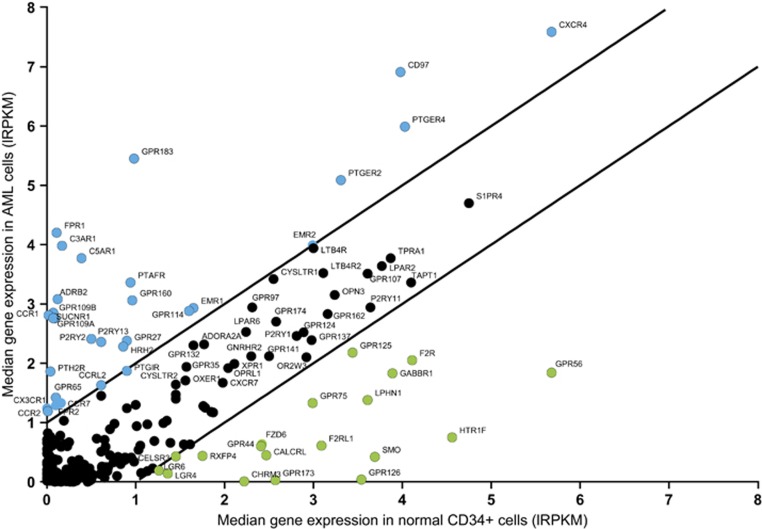
Figure 2.
Relation between GPCR expression in AML and in normal cord blood-derived CD34+ cells. The median gene expression level of 772 GPCRs in AML cells (y axis) is represented against their expression in normal cord blood-derived CD34+ cells (x axis). The 30 upregulated GPCRs in AML (blue dots) have a difference in median expression level between AML and normal CD34+ cells greater than 1. The 19 downregulated GPCRs in AML (green dots) have a difference in median expression less than −1. GPCRs represented in black dots are not differentially expressed between AML and normal CD34+ cells. RNA-Seq data were transformed to lRPKM (log2(RPKM+1)).

