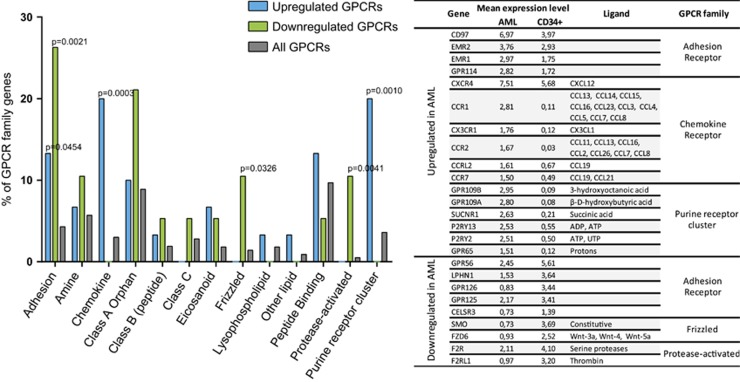
Figure 3.
GPCR subfamily distribution of upregulated and downregulated GPCRs in AML. The left panel shows the proportion of genes upregulated or downregulated in AML and all GPCRs into different subfamilies of GPCRs (adhesion, amine, chemokine and so on). The P-values are indicated for significant families by Fisher's exact tests. The right panel shows individual GPCRs of enriched groups. Values indicated in second and third columns correspond to the receptor mean expression level in AML and CD34+ cells. All represented GPCRs have mean expression levels in AML significantly different from their mean in normal CD34+ cells, P-values<0.005. The Fisher's exact test was performed between the upregulated or downregulated group and remaining GPCRs, i.e., all GPCRs excluding differentially expressed genes.

