Figure 2.
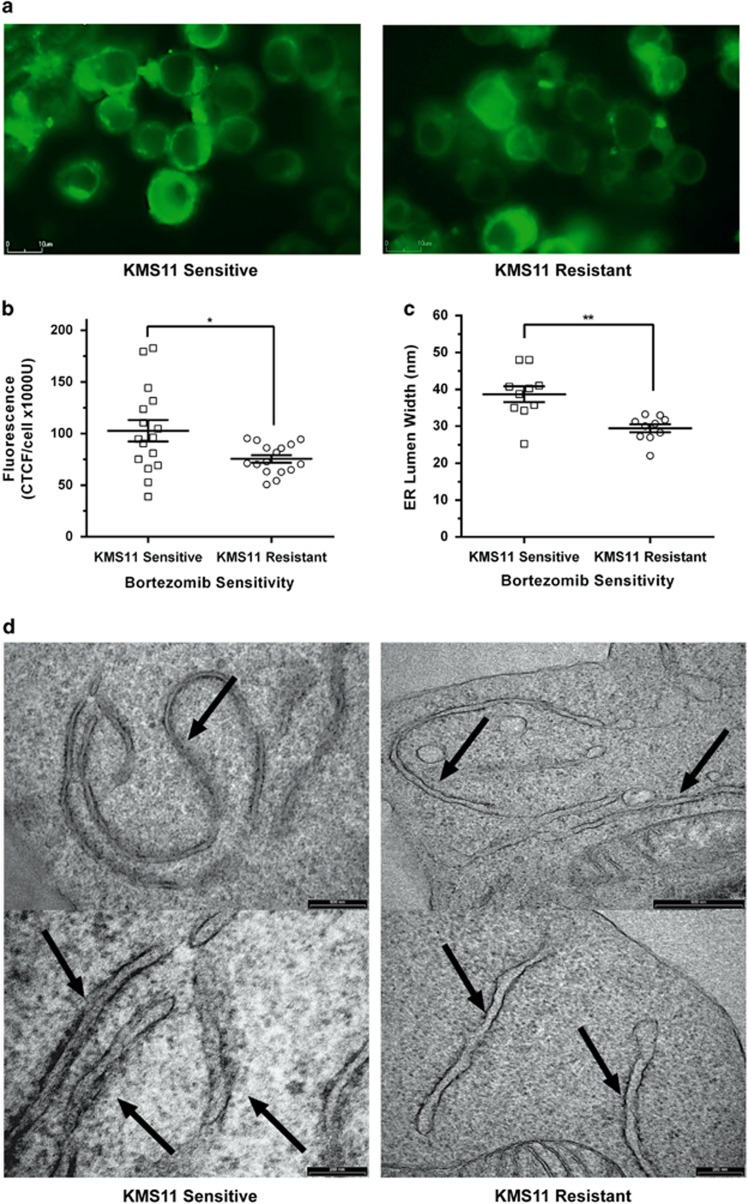
ER imaging of Bortezomib-sensitive and -resistant KMS11 cells. (a) Representative images of live cell staining of KMS11-sensitive and -resistant cells, incubated with 100 nm of ER tracker dye (green). Images were captured at × 80 magnification. (b) ER fluorescence/area of KMS11-sensitive (n=16) and -resistant (n=16) cells using an ER tracker dye. Data are shown as mean of values (centre bar)±s.e.m. (error bars; n=16; *P=0.0235, t-test). Scale bar, 10 μm. Dot plots of individual data values. (c) Mean RER lumen widths of KMS11-sensitive cells (n=10) and KMS11-resistant cells (n=10) at × 40 000 magnification as measured by electron microscopy. Data are shown as mean measurement values±s.e.m. (**P=<0.0001, t test) (bar and error bar). Each dot plot point represents the average of the 4 broadest points measured for each RER lumen (d) Electron microscopy of the ER lumen (shown by arrows) in KMS11 Bortezomib sensitive (left panels) and resistant cells (Right panel). Top panel is at 500 nm and the bottom panel scale bar is 200 nm.

