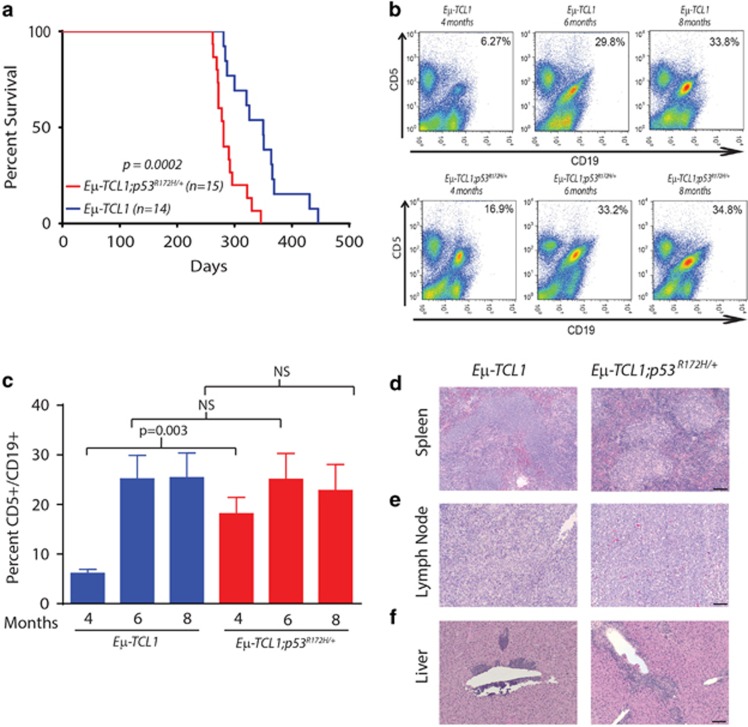
Figure 1.
Mutant p53 results in reduced survival, but phenotypically similar disease progression in Eμ-TCL1 mice. (a) Kaplan–Meier curves of Eμ-TCL1;p53R172H/+ and Eμ-TCL1 mice. (b) Flow cytometry data demonstrating the CD5+/CD19+ immunophenotypes in the peripheral blood of Eμ-TCL1;p53R172H/+ and Eμ-TCL1 mice at 4, 6 and 8 months of age. Cells were gated by their expression of CD5, CD19 and CD5/CD19. (c) Bar graph representing the percent of CD5+/CD19+ cells in the peripheral blood of Eμ-TCL1;p53R172H/+ (n=6) and Eμ-TCL1 (n=6) mice at 4, 6 and 8 months of age. NS represents non-significant values (P>0.05) (d–f) Hematoxylin and eosin staining of tumor burdened spleens, lymph nodes, livers of Eμ-TCL1;p53R172H/+ and Eμ-TCL1 mice. The scale bar represents 100 microns.

