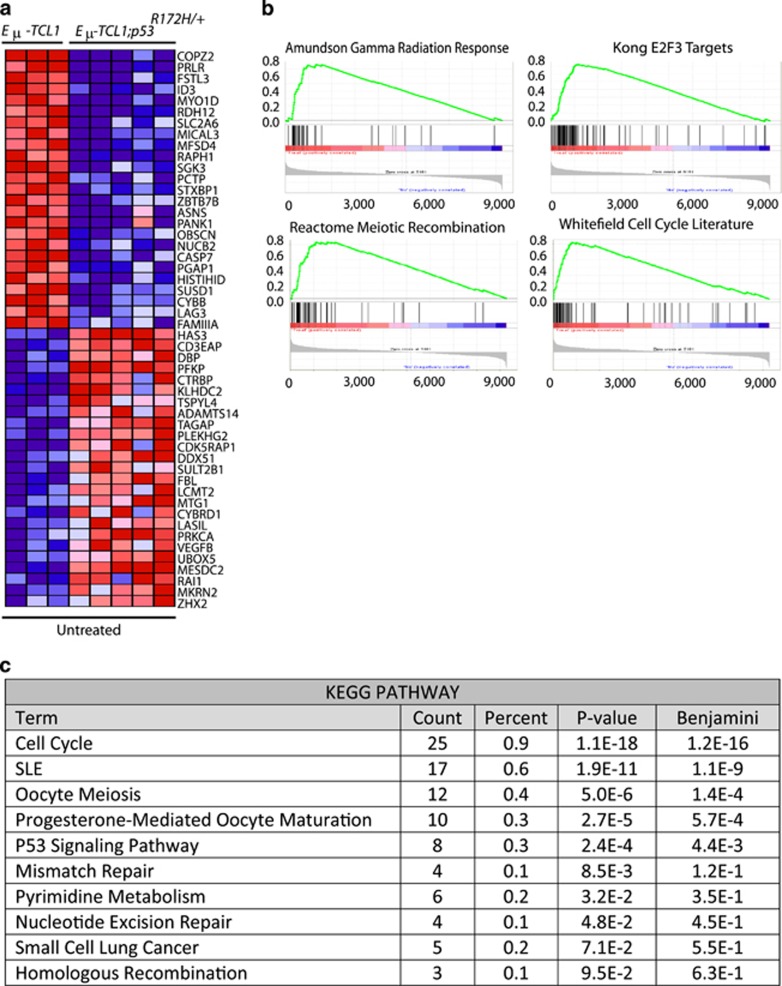
Figure 2.
Differential gene expression profiling between B-cells from Eμ-TCL1 and Eμ-TCL1;p53R172H/+ mice. (a) Heat map of hierarchical clustering of gene expression profiles between B-cells from Eμ-TCL1 and Eμ-TCL1;p53R172H/+ mice. (b) Gene set enrichment analysis enrichment plots of differentially expressed gene sets from B-cells isolated from Eμ-TCL1 and Eμ-TCL1;p53R172H/+ mice. Reactome Meiotic Recombination, normalized enrichment score (NES)=2.39 and false-discovery rate (FDR)=0.075; Amundsom Gamma Radiation Response, NES=2.014 and FDR=0.198; Kong E2F3, NES=1.99 and FDR=0.192; and Whitefield Cell Cycle Literature, NES=1.97, FDR=0.200. (c) KEGG-pathway analyses of differentially regulated biological pathways in B-cells from Eμ-TCL1 and Eμ-TCL1;p53R172H/+ mice.

