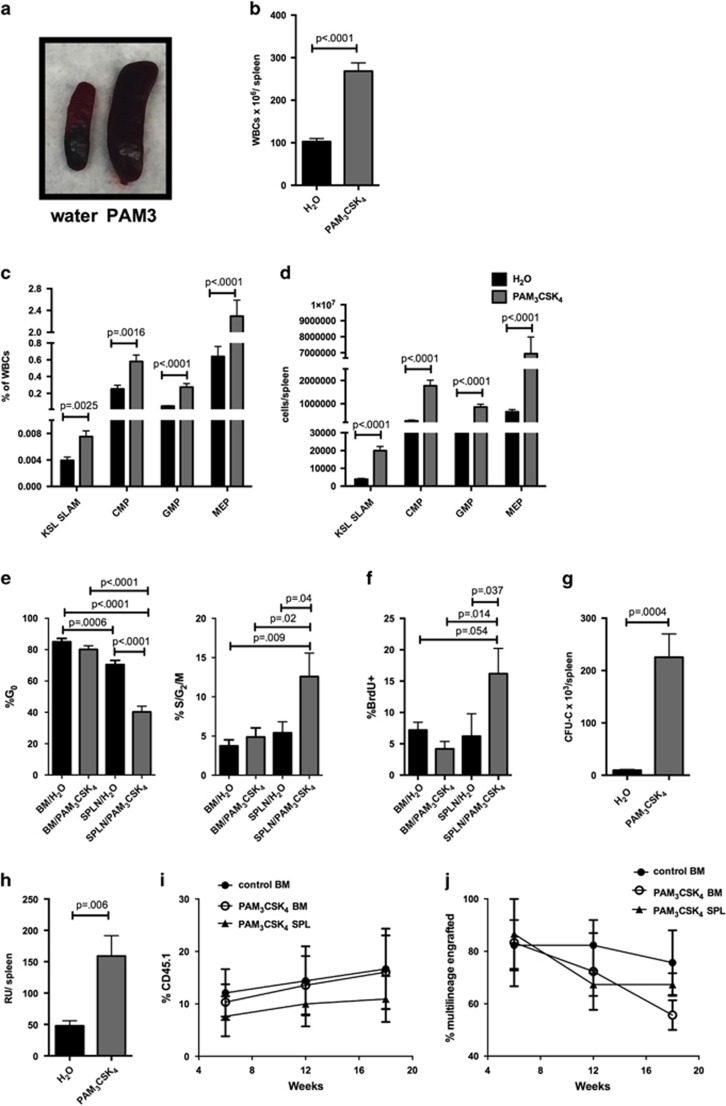
Figure 2.
TLR2 agonist treatment leads to marked expansion of spleen HSPCs. WT mice (6–8 weeks old) were treated with PAM3CSK4 (100 μg intraperitoneally (i.p.) q48 h × 3 doses, analyzed 24 h after final dose). (a) Representative spleens from control water-treated (left) and PAM3CSK4-treated (right) mice. Shown are the total leukocytes per spleen (b) and the frequency (c) and absolute numbers (d) of KSL SLAM cells, common myeloid progenitors (CMPs), granulocyte–monocyte progenitors (GMPs) and megakaryocyte–erythroid progenitors (MEPs) in the spleen as determined by flow cytometry (n=11–13 mice per treatment group). The cell cycle status of KSL SLAM cells in the bone marrow and spleen was determined by flow cytometry using Ki-67 and DAPI (e) or BrdU incorporation (f) (n=7–10 mice per group). (g) Whole spleen cells from PAM3CSK4-treated mice or water-treated controls were plated on complete methylcellulose, and colonies counted after 7 days of growth at 37 °C (n=7 mice per group). (h) To determine HSC function, 2 × 10⁶ whole spleen cells (CD45.1) from control or PAM3CSK4-treated mice were transplanted along with 1 × 10⁶ whole bone marrow competitor cells (CD45.2) into lethally irradiated WT recipients (CD45.1/CD45.2). Shown are total repopulating units per spleen at 18 weeks post transplant. Repopulating units were determined using the equation RU=([% chimerism of test donor-derived cells] × [no. of competitor cells] × 10−5)/% chimerism of competitor-derived cells. The result was then multiplied by total spleen WBCs to obtain RUs/spleen. Data represent seven mice per treatment group from two independent experiments. (i, j) Twenty KSL SLAM HSCs (CD45.1) from the spleens or bone marrow of PAM3CSK4-treated mice were transplanted with 3 × 10⁵ whole marrow support cells (CD45.2) into irradiated recipients. Shown are % donor (CD45.1) leukocytes in the recipients (i) and % of recipients with multilineage (⩾1% in myeloid and lymphoid lineages) donor (CD45.1) engraftment (j). Data represent 11–12 mice per group from 3 independent experiments. For all panels, error bars represent mean±s.e.m.. Data in (i and j) were analyzed by two-way analysis of variance (ANOVA) with multiple comparisons, and all other P-values were determined by two-tailed Student's t-test.

