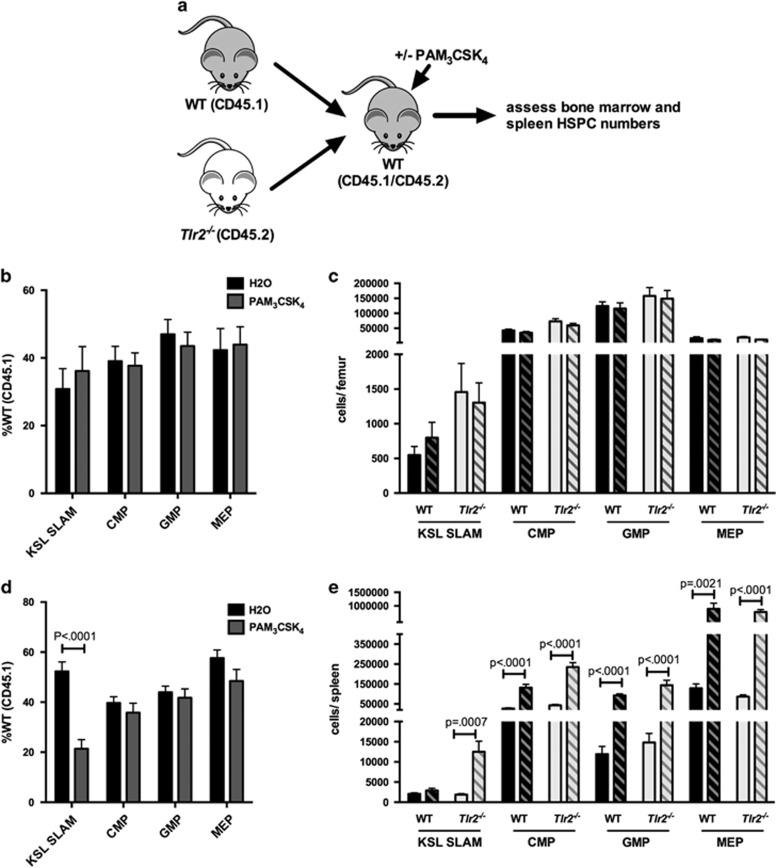
Figure 3.
TLR2 agonist effects on HSPCs are, at least in part, cell non-autonomous. (a) Chimeric animals were generated by transplanting equal numbers of WT (CD45.1) and Tlr2−/− (CD45.2) bone marrow cells into lethally irradiated WT (CD45.1/CD45.2) recipients. After allowing time for engraftment (12 weeks), recipients were treated with PAM3CSK4 (100 μg intraperitoneally (i.p.) q48 h × 3 doses) and the relative frequencies (b, d) and absolute numbers (c, e) of HSPCs in the bone marrow (b, c) and spleen (d, e) were determined by flow cytometry. (b) The frequency of WT (CD45.1) HSPCs for each indicated cell type in the bone marrow after treatment is shown. (c) Absolute numbers of cells per femur after treatment of chimeras is shown. Dark bars indicate WT (CD45.1) cells, and light bars indicate Tlr2−/− (CD45.2) cells. Solid bars indicate water-treated controls, and hatched bars indicate PAM3CSK4-treated mice (n=10 mice per treatment group). (d) The frequency of WT (CD45.1) HSPCs for each indicated cell type in the spleen after treatment is shown. (e) Absolute numbers of cells per spleen after treatment of chimeras is shown. Dark bars indicate WT (CD45.1) cells, and light bars indicate Tlr2−/− (CD45.2) cells. Solid bars indicate water-treated controls, and hatched bars indicate PAM3CSK4-treated mice (n=10 mice per treatment group). For all panels, error bars represent mean±s.e.m., and P-values were determined by the two-tailed Student's t-test.

