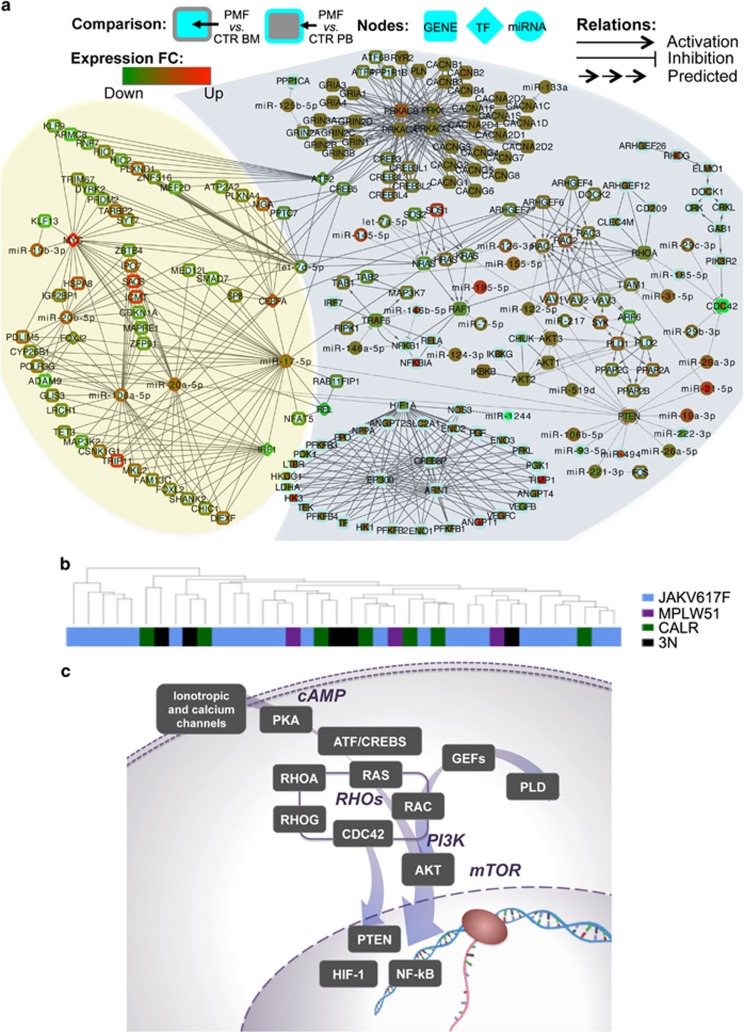
Figure 2.
PMF network model. (a) PMF network integrating pathway-derived miRNA-gene networks deregulated in PMF and mixed TF-miRNA-gene circuits discovered by reverse engineering of expression data. The network (see Supplementary Figure 3 for a larger version) gives a non-redundant and comprehensive picture of most modulated paths in the two PMF vs CTR comparisons, of the impact of miRNAs on pathway genes, and of connected TF-miRNA-gene mixed circuits discovered in the study. Genes are reported as round rectangles, transcriptional factors as diamonds and miRNAs as triangles. Node colors represent the fold-change (FC) of the gene expressions in the PMF vs CTR BM (node inner color) and PMF vs CTR PB (node border color). The type of edges depends on the type of interaction: arrow for activation, T arrow in case of inhibition, and arrow line for miRNA-target predicted/supported interactions. The light blue shade indicates the part of the network resulting from miRNA and gene topological pathway analysis. The yellow shade indicates mixed TF-miRNA-gene circuits, inferred by Magia2 analysis, connected to the path-derived network. (b) Cluster analysis of expression profiles of miRNAs and genes included in the final PMF network do not show clustering of PMF patients by mutation. Samples are colored according to the carried mutation as shown in the legend (3N indicates triple negative). Sample clustering was obtained according to Euclidean distance and complete clustering. See Supplementary Figure 4 for the corresponding heatmap. (c) Summary of most deregulated pathways represented in the miRNA-gene network, and connections thereof. See http://compgen.bio.unipd.it/pmf-net/ for an interactive, searchable and zoomable version of the PMF network model.

