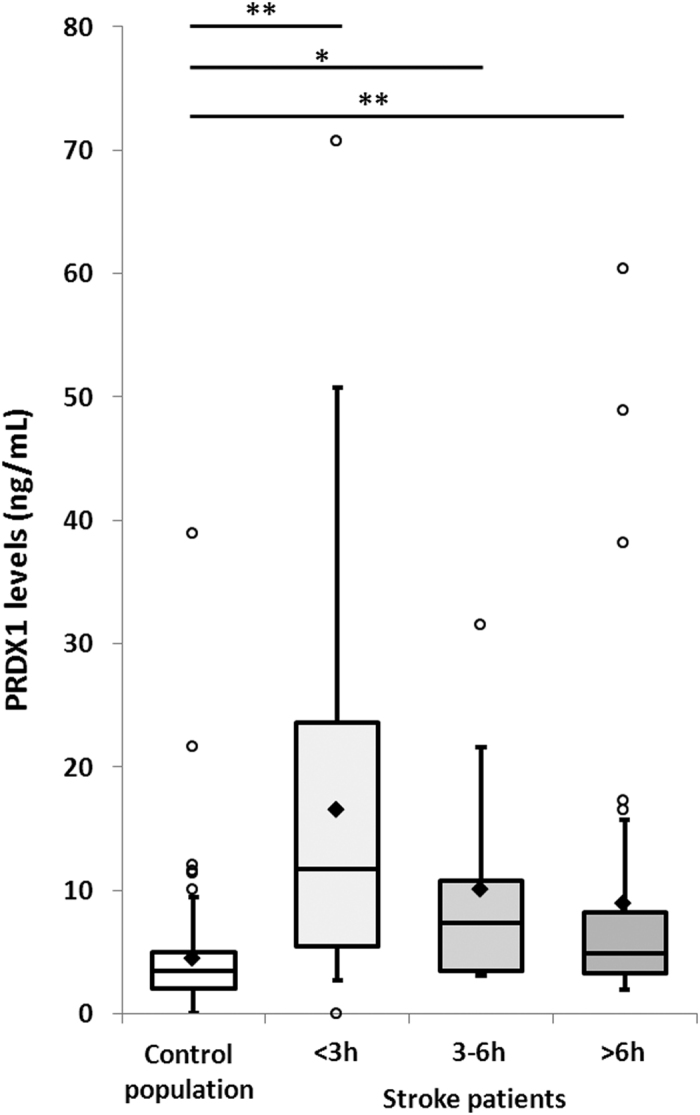
Figure 3. Peroxiredoxin 1 levels in the control population and stroke patients per time window.

Tukey’s box-and-whisker plots, box limits: interquartile range (IQR), middle line: median, diamond: mean, vertical lines: adjacent values (1st quartile −1.5 IQR; 3rd quartile +1.5 IQR), dots: outliers, peroxiredoxin 1 levels from 109 collections in control population and 82 collections from stroke patients (32 samples during the first 3 hours, 7 samples between 3 and 6 hours, and 43 samples after 6 hours following stroke onset). PRDX1: peroxiredoxin 1, <3 h: within the first 3 hours, 3–6 h: between 3 and 6 hours, >6 h: after 6 hours following stroke onset, *p < 0.05, **p < 0.01 Mann–Whitney U test.
