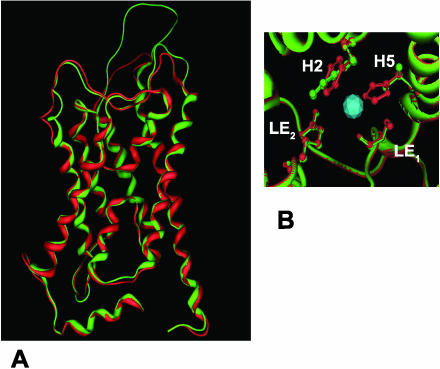
Figure 2.
Structural analysis of the nodulin 26 homology model. A, Superposition of the experimental AQP1 structure (red) and the nodulin 26 homology model (green) is shown viewed perpendicular to the pore of the protein. B, The superposed positions of the ar/R tetrad for AQP1 (red) and nodulin 26 (green) are shown viewed perpendicular to the plane of the membrane. The positions of the ar/R residues from H2, H5, and loop E (LE1 and LE2) are indicated.

