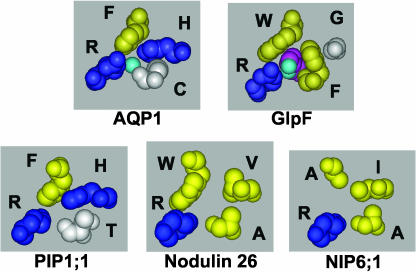
Figure 3.
Comparison of the ar/R selectivity regions of the NIP and PIP subfamilies. Space-filling side-chain residues of the ar/R selectivity region of AtPIP1;1, soybean nodulin 26, and AtNIP6;1 shown compared to AQP1 and GlpF with conductant bound. The single-letter amino acid code appears along side each residue, and residue side chains are colored blue for basic hydrophilic, yellow for hydrophobic, and white for neutral hydrophilic. The ar/R filter in each projection is viewed perpendicular to the plane of the bilayer from the extracellular vestibule.

