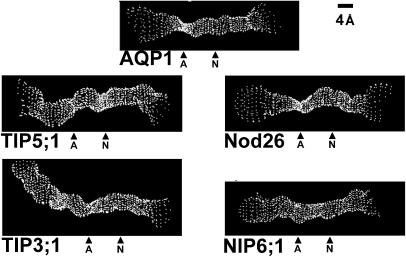
Figure 4.
Analysis of the putative pore dimensions of representative plant MIPs compared with AQP1. The dimensions of the pore regions of AQP1 and the molecular models of nodulin 26, NIP6;1, TIP3:1, and TIP5;1 were analyzed by using the HOLE program (Smart et al., 1993) and were visualized on InsightII. The pores are viewed perpendicular to the pore axis and are labeled with respect to the location of the ar/R (A) and NPA (N) regions.

