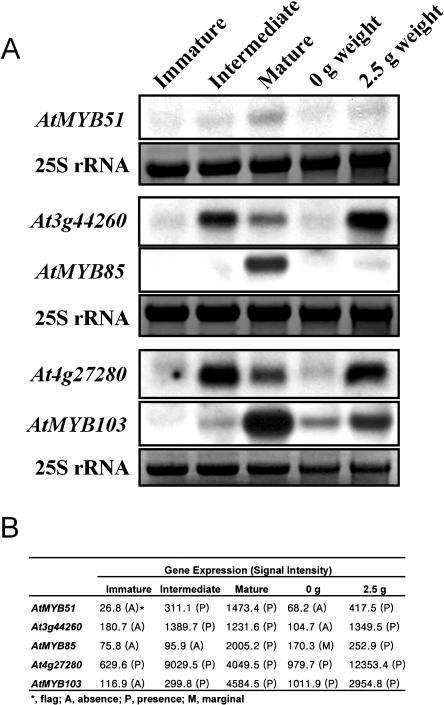
Figure 4.
Confirmation of signal intensity of GeneChip data with conventional northern-blot analysis. A, Northern-blot analysis. RNA gel-blot analysis was performed with 15 μg of total RNA extracted from each sample indicated above and hybridized with the randomly labeled cDNA probes indicated on the left side. All of the RNA samples are duplicates of the RNAs used in the GeneChip analysis. Exposed to Kodak x-ray film for 1 d (Rochester, NY). 25S rRNA serves as a RNA loading control. B, Signal intensity of the GeneChip data.

