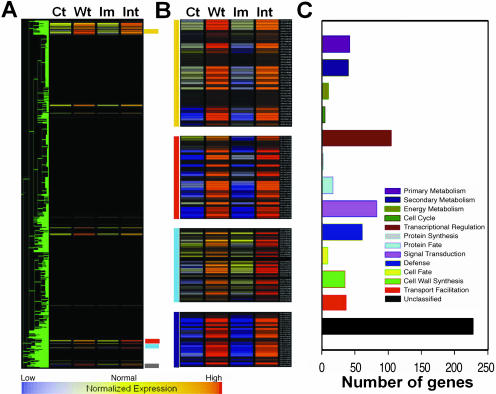
Figure 5.
Comparison of gene expression patterns with weight treatment and intermediate stem. A, Gene finding using hierarchical clustering; 700 genes have similar expression pattern (with minimum correlation of 0.95). Normalization and K-Mean clustering was done by GeneSpring 4.2.1 software (Silicon Genetics, Redwood City, CA). The expression patterns of the selected 700 genes are selectively shown. B, Magnifying view of each cluster in (A). Supplemental Table provides the list of genes. Ct, control; Wt, 2.5-g weight treatment; Im, immature; Int, intermediate stem. C, Functional classifications. Classification was based on the Munich Information Center for Protein Sequences (http://mips.gsf.de/proj/thal/db/tables/tables_func_frame.html).

