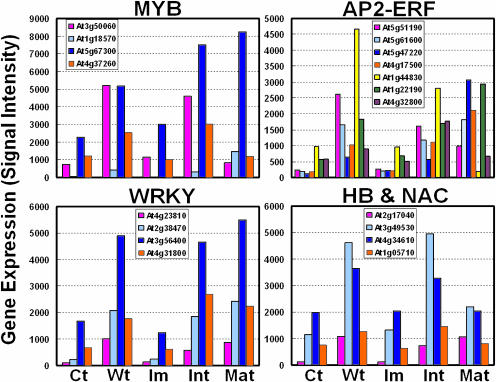
Figure 6.
Expression profiles of transcription factor candidates might be involved in the transition from primary to secondary growth. Gene expression (y axis) designates the mean value of signal intensity of each gene. Note the different scope. Ct, control; Wt, 2.5-g weight treatment; Im, immature; Int, intermediate stem; Mat, mature stem.

