
Figure 2.
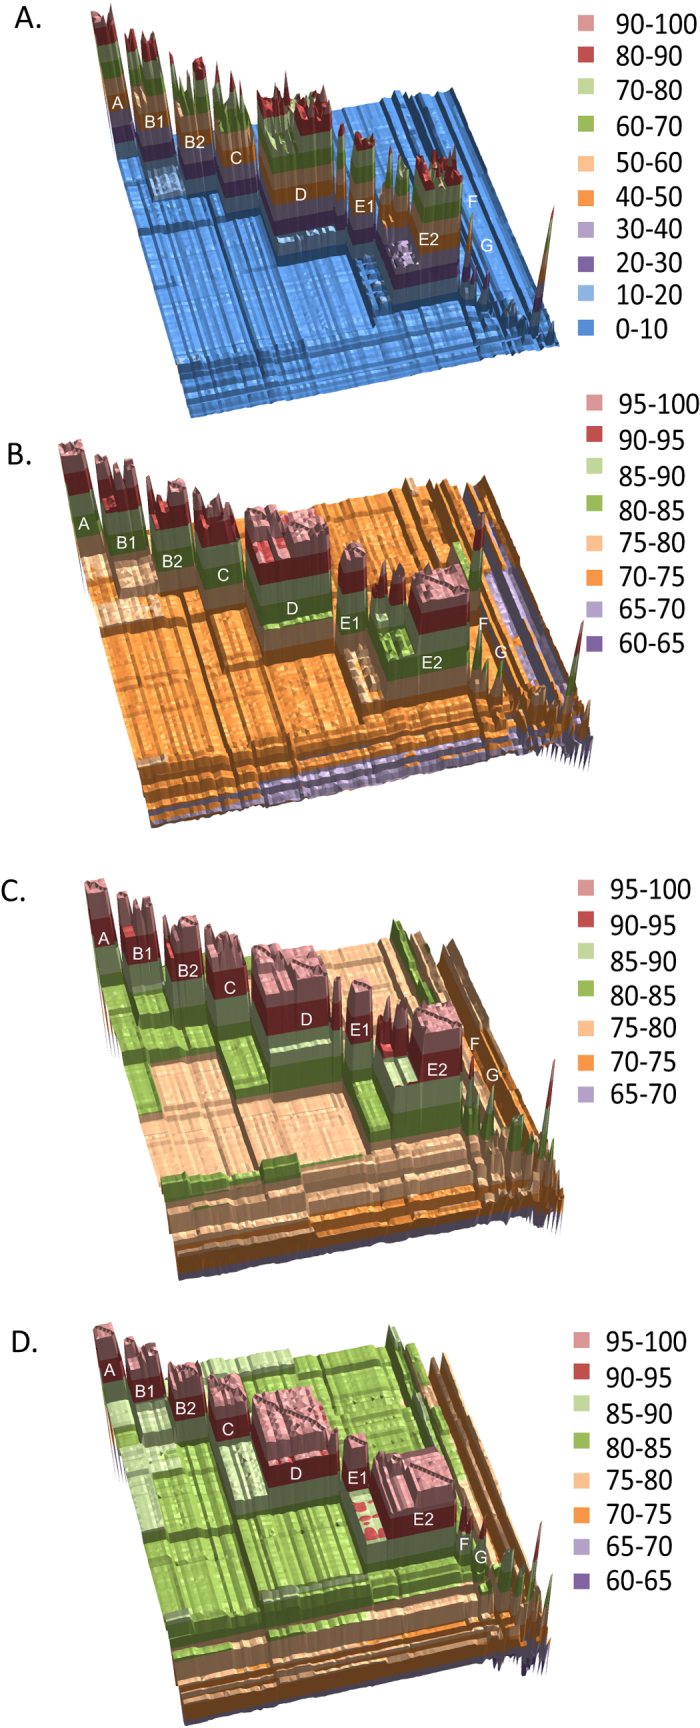
3D graphical representation of pairwise similarity matrices obtained by (A) fragmented BLAST searches (FBS values), (B) genomic average nucleotide identities (ANIb-G values), (C) average nucleotide identities among core genes (ANIb-C values) and (D) average amino-acid identities from the core genes (AAI values). Rhodococcus species-groups A-G are labelled whilst the reference genera are plotted at the lower right hand corner.