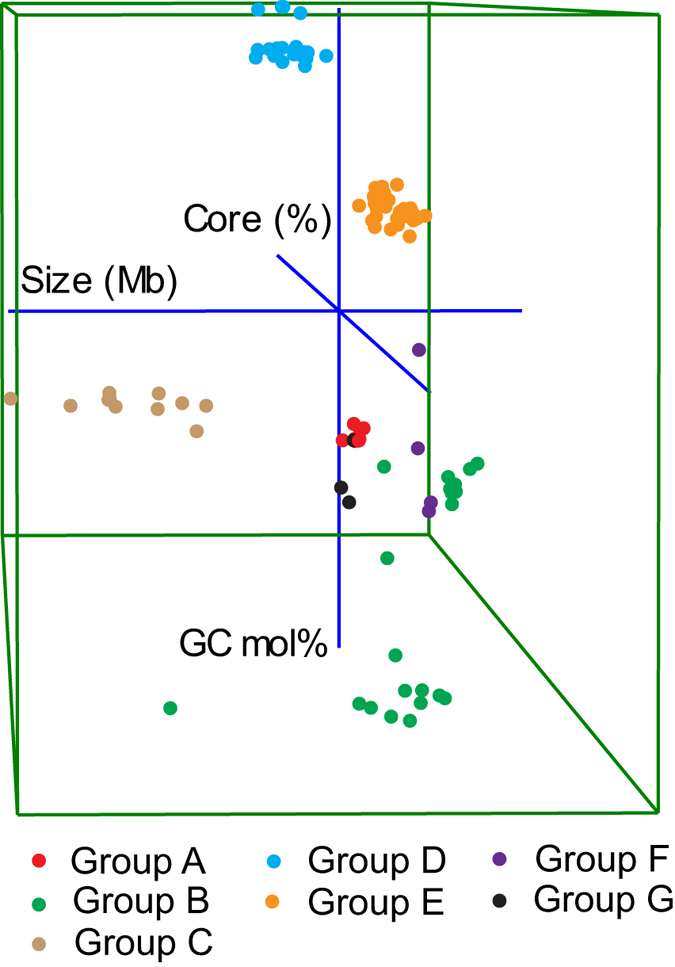
Figure 4. A 3D distribution of genome size, GC content and fraction of shared genes within each species-group (Supplementary Table 1).

The three axes are shown in blue in the centre of the plot and are labelled. The individuals belonging to seven species-groups are shown in different colours.
