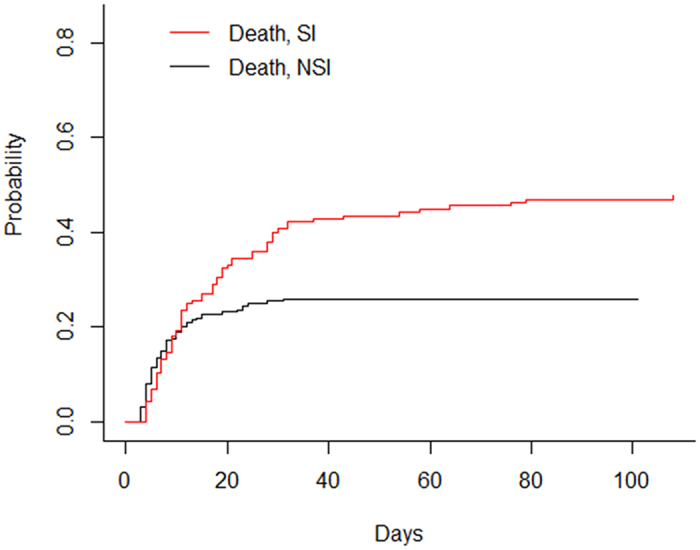
Figure 3. Cumulative incidence functions for discharge and death.

Solid lines: discharge; dashed lines: death; read lines: secondary infection; black lines: no secondary infection. SI: secondary infection; NSI: no secondary infection.

Solid lines: discharge; dashed lines: death; read lines: secondary infection; black lines: no secondary infection. SI: secondary infection; NSI: no secondary infection.