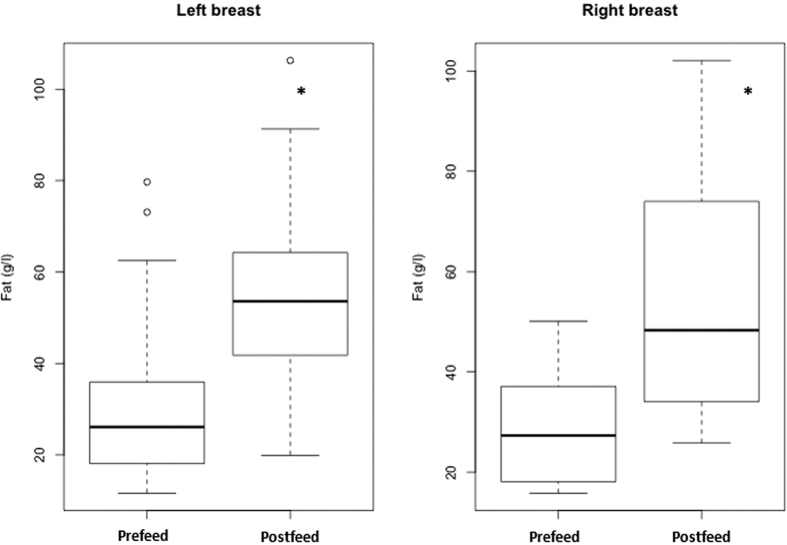
Figure 1. Distribution of fat content in pre- and postfeed milk collected from each breast from 2 to 12 months (n = 99 samples from 16 mothers).
The fat contents are shown by box plots illustrating range (error bars), quartiles (box), median (indicated by bold line) and outliers (o). *Indicates significant difference (P < 0.05).

