Figure 3.
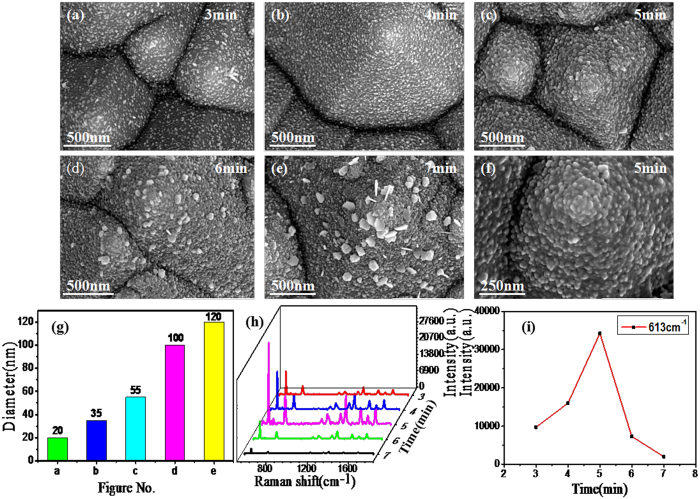
(a–e) SEM image of the different reaction time (3-7 min) of the AgNPs/PCu@Si substrates. (f) is the magnified image of the sample in (c). (g) is histogram of the diameter of Ag nanoparticles from Fig. 3(a) to (e). (h) SERS spectra of R6G (10−8 M) on those AgNPs/PCu@Si substrates fabricated with different reaction time (3-7 min). (i) The intensity of the R6G at 613 cm−1 peak changes as a function of replacement reaction time.

