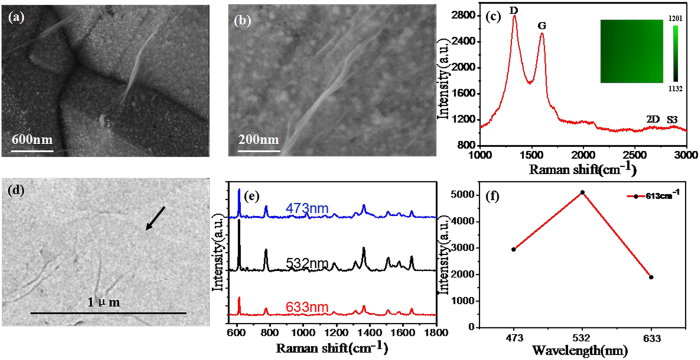
Figure 4.
(a) SEM image of GO/AgNPs/PCu@Si substrate. (b) is the SEM image of GO/AgNPs/PCu@Si substrate under a larger magnification. (c) Raman spectrum of the GO and the Raman mapping in the inset. (d) TEM of the GO film. (e) Raman spectrum of R6G with the concentration of 10−12 M on the GO/AgNPs/PCu@Si substrate under the laser wavelength with 473, 532 and 633 nm respectively. (f) The intensity of the R6G at 613 cm−1 peak changes as a function of the laser wavelength.

