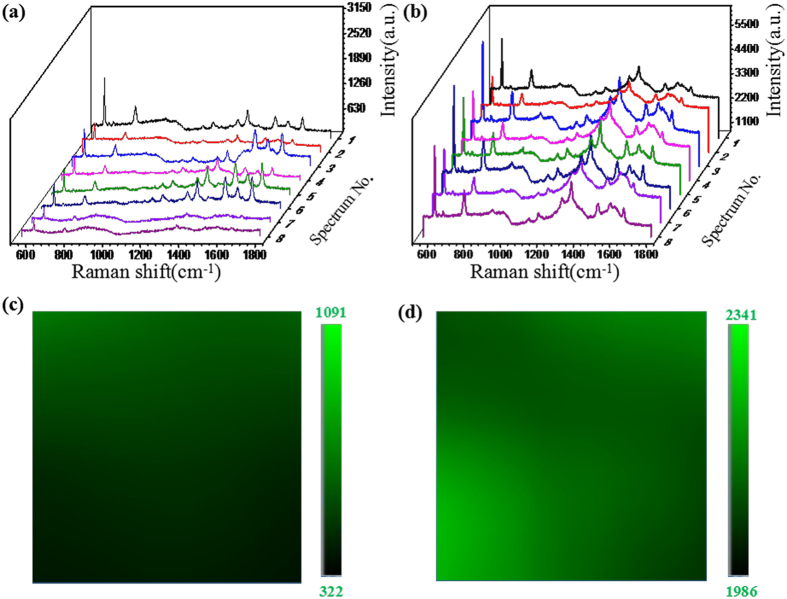
Figure 6.
(a) and (b) are respectively SERS spectra of the R6G with concentration of 10−15 M from 8 spots on the AgNPs/PCu@Si and GO/AgNPs/PCu@Si substrate. (c) and (d) are the Raman mapping at 613 cm−1 of R6G molecules at 10−15 M dispensed on the GO/AgNPs/PCu@Si substrates and the AgNPs/PCu@Si substrates respectively.

