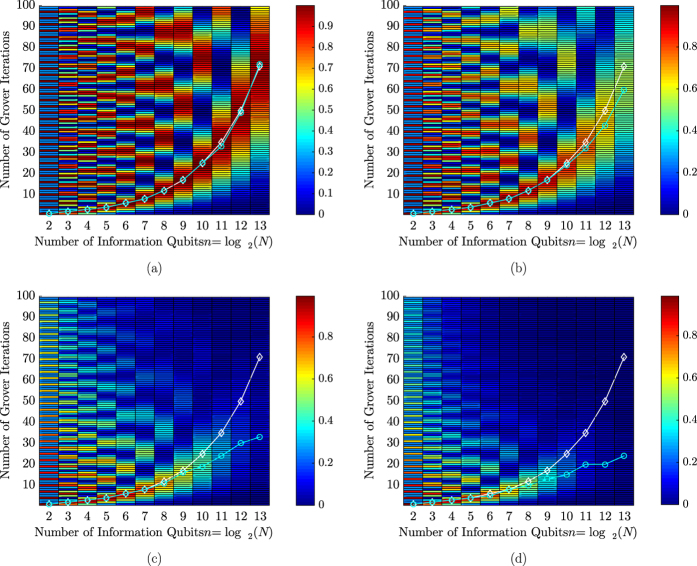
Figure 4.
Success probability of Grover’s QSA, when a depolarizing channel appears only right before the Oracle in Grover’s operator’s circuit, shown in Fig. 1, with respect to the depolarizing probability of the channel (a) p1 = 10−4, (b) p1 = 10−3, (c) p1 = 5 · 10−3, (d) p1 = 10−2, the size of the database N and the number of Grover iterations L. The circuit architecture of Fig. 2 was employed. Randomly generated databases with different sizes N were used, while a single solution S = 1 was present in a random position in the database in each search problem. The white curve marked by the diamonds indicates the optimal number of Grover iterations Lopt that would be required in the ideal Grover’s QSA, associated with p1 = 0, while the cyan curve marked by the circles represents the actual optimal number of Grover iterations for the specific value of depolarizing probability p1.

