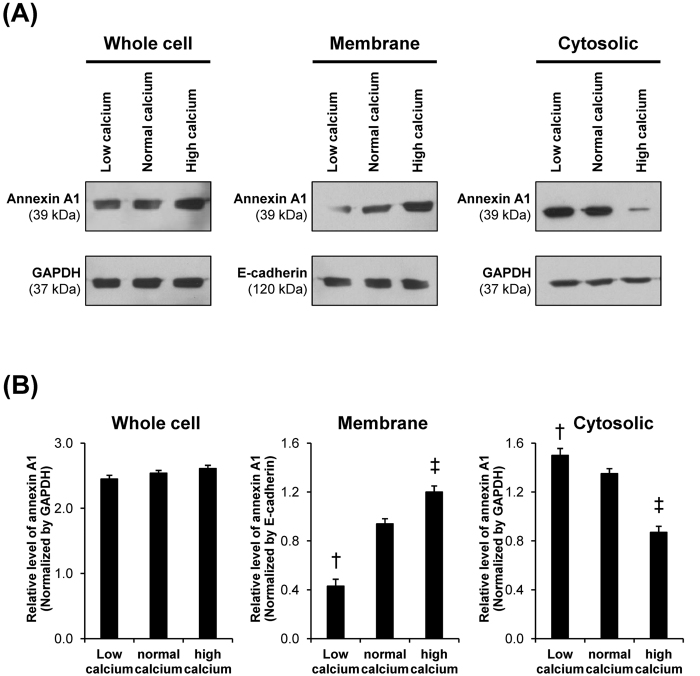
Figure 7. Western blotting analysis of effects of differential calcium levels on annexin A1 expression level and localization.
(A) Proteins derived from whole cell lysate, membrane fraction, and cytosolic fraction of the cells maintained in media with differential calcium levels, including low-calcium (with 0.2 mM calcium), normal-calcium (with 1.8 mM calcium), and high-calcium (with 20 mM calcium) media (details are provided in Supplementary Table S1) for 3-h were subjected to Western blotting of annexin A1. GAPDH served as the loading control for whole cell lysate and cytosolic fraction, whereas E-cadherin served as the loading control for membrane fraction. Full-length blots of these cropped images are presented in Supplementary Figure S2. (B) Band intensity was quantitated using ImageQuant TL software (GE healthcare). Each bar represents mean ± SEM from 3 independent experiments. †p < 0.05 vs. normal-calcium and high-calcium conditions; ‡p < 0.05 vs. normal-calcium and low-calcium conditions.

