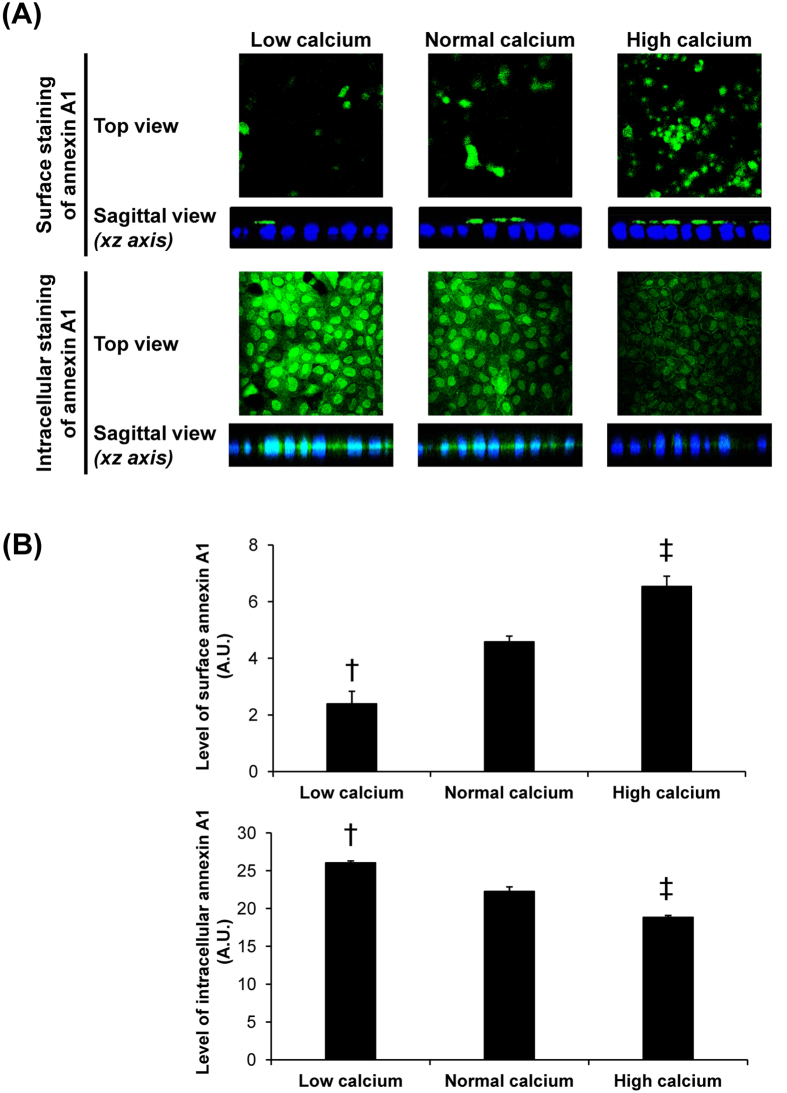
Figure 8. Immunofluorescence study of effects of differential calcium levels on annexin A1 expression level and localization.
(A) The fixed cells without permeabilization were processed for apical surface staining, whereas the fixed and permeabilized cells were processed for intracellular staining of annexin A1. After incubation with mouse monoclonal anti-annexin A1 (Santa Cruz Biotechnology) and corresponding secondary antibody conjugated with Alexa Fluor 488, surface and intracellular annexin A1 was visualized (in green) using a laser-scanning confocal microscope (ECLIPSE Ti-Clsi4 Laser Unit) (Nikon). The nuclei are shown in blue. Original magnification was 630× for all panels. (B) The mean fluorescence intensity of annexin A1 in each condition was analyzed using NIS-Elements D V.4.11 software (Nikon) from at least 100 individual cells per condition. Each bar represents mean ± SEM from 3 independent experiments. Exposure time = 400 ms; A.U. = arbitrary unit; †p < 0.05 vs. normal-calcium and high-calcium conditions; ‡p < 0.05 vs. normal-calcium and low-calcium conditions.

