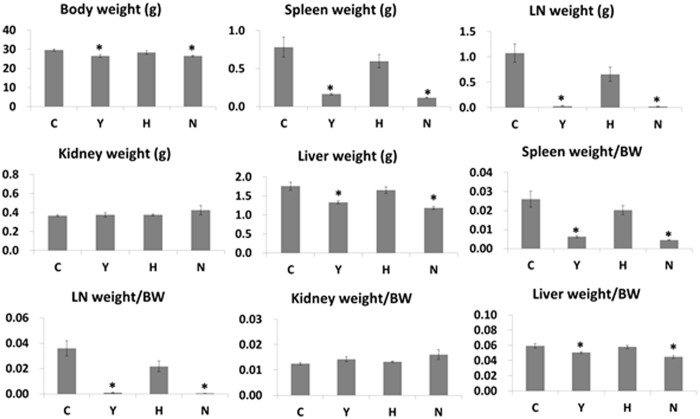
Figure 1. Body weight and organ weights in C3.MRL-Faslpr/J mice and background matched control C3H mice after treatment.
The mean weights of the spleen, lymph node, and liver, as well as individual organ/body weight ratios are presented. C: control group (C3.MRL-Faslpr/J mice), Y: cyclophosphamide-treatment group (C3.MRL-Faslpr/J mice), H: ASC-treatment group (C3.MRL-Faslpr/J mice) and N: normal group (Background-matched control C3H mice).

