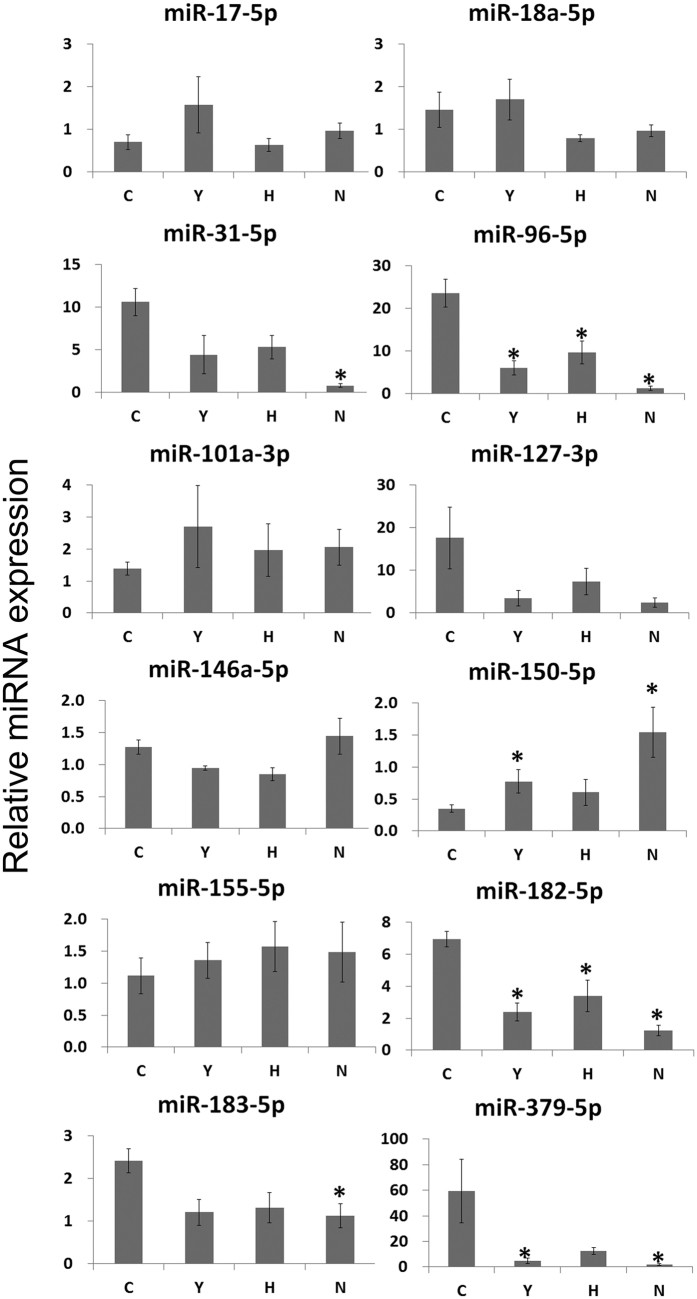
Figure 4. Comparison of the expression levels of common lupus disease-associated miRNAs in spleens among the groups.
The expression levels of common lupus disease-associated miRNAs in spleens. Data are normalized to those of RNU6-2 and SNORD96A (average CT) and are expressed as mean (bars) ± SEM (error bars) of the relative amount compared to one sample from the normal group. Data obtained from groups were analyzed using a one-way analysis of variance followed by post hoc Tukey’s multiple comparison tests. *significant (p < 0.05) differences from the control (C) group are indicated by an asterisk. N: normal group (C3H), C: control group (C3.MRL-Faslpr/J), saline-, Y: cyclophosphamide-, H: ASC-treatment group.

