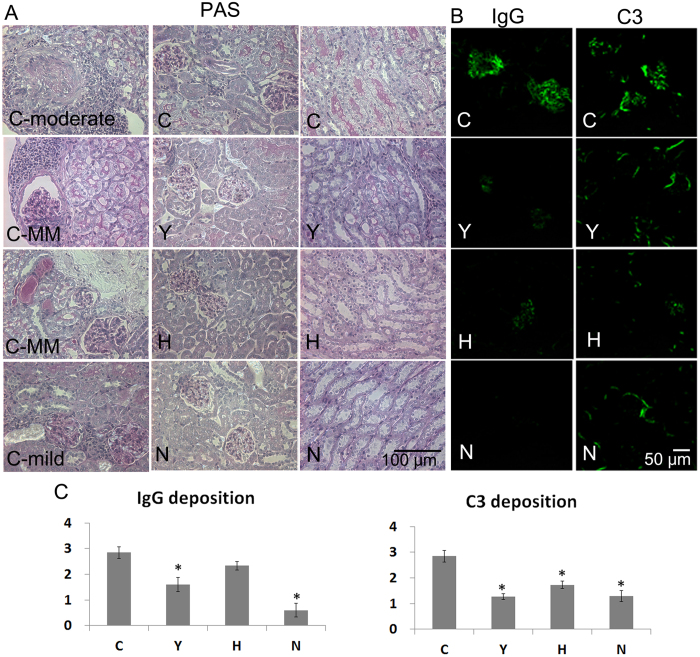
Figure 5. Histological staining and immunofluorescence of kidney samples.
(A) Periodic acid-Schiff staining of kidney tissue. Bar = 50 μm. (B) Immunofluorescent staining of kidney samples from the experimental groups was conducted using FITC-anti IgG or FITC-anti C3 antibodies to compare the effects of various treatments. Bar = 50 μm. (C) IgG and C3 deposition scores in the glomerula. The intensity of fluorescence was graded on a scale of 0 (none) to 4 (great fluorescence intensity). Data obtained from each group were compared using ANOVA followed by post hoc Tukey’s multiple comparison tests (C: n = 13, Y: n = 15, H: n = 15, and N: n = 10). *significant (p < 0.05) differences from the control (C) group are indicated by an asterisk. MM: mild to moderate, N: normal group (C3H), C: control group (C3.MRL-Faslpr/J), saline-, Y: cyclophosphamide-, H: ASC-treatment group.

