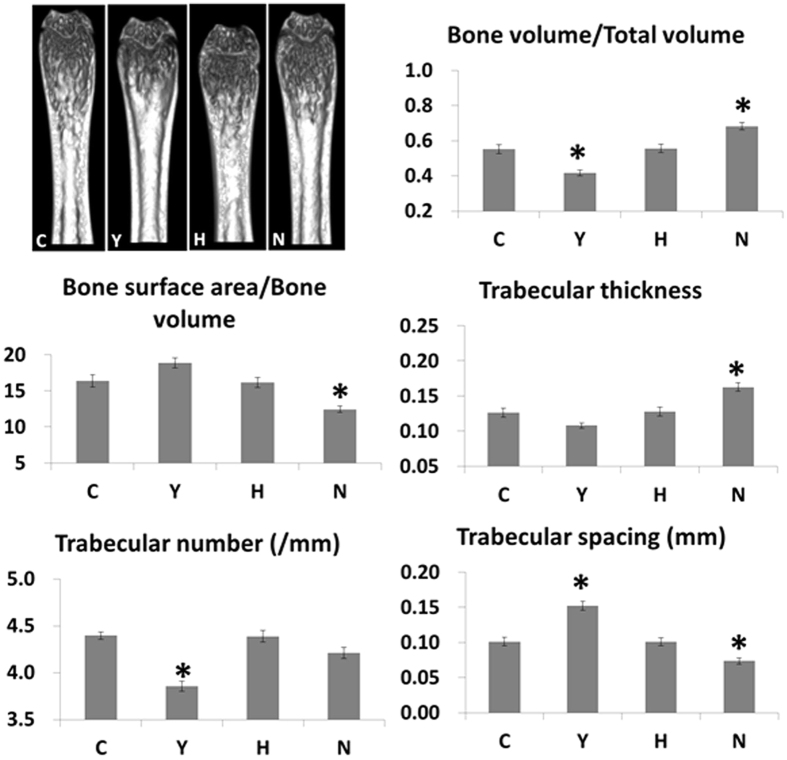
Figure 6. Micro-CT images from the distal femoral metaphysis and bone morphometric analyses.
Representative micro-CT images of the distal femoral metaphysis and the bone volume relative to tissue volume, bone surface area relative to bone volume, trabecular thickness, trabecular number and trabecular spacing values from the experimental groups. Data obtained from each group were compared using ANOVA followed by post hoc Tukey’s multiple comparison tests (C: n = 13, Y: n = 15, H: n = 15, and N: n = 10). *significant (p < 0.05) differences from the control (C) group are indicated by an asterisk. N: normal group (C3H), C: control group (C3.MRL-Faslpr/J), saline-, Y: cyclophosphamide-, H: ASC-treatment group, Bone volume relative to tissue volume (BV/TV, C), trabecular number (Tb.N, D), and bone surface area (BS, E).

