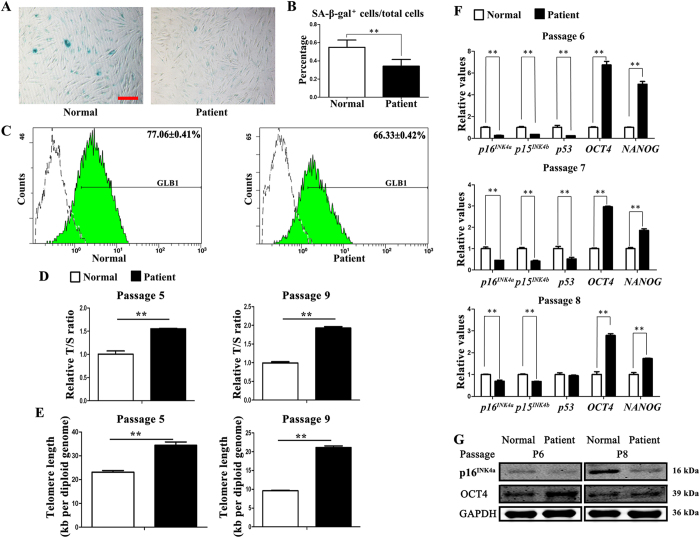
Figure 2. TDO-BMSCs exhibit slower senescence rate than CON-BMSCs.
(A) Representative images of cells assayed for SA-β-gal activity (blue) (scale bar, 100 μm). (B) Percentages of SA-β-gal+ cells/total cells from experiments as in panel (A) β-gal activity normalized to total cells. (C) Flow cytometry of the percentage of GLB1 expression compared with isotype controls. (D) Relative telomere length expressed as relative T/S ratio measured by quantitative real-time PCR analysis showing remarkably longer telomeres of TDO-BMSCs at passage 5 and 9. (E) Absolute telomere length expressed kb/diploid genome determined by qPCR also displaying longer telomeres of TDO-BMSCs at passage 5 and 9. (F) Real-time PCR for p16INK4a, p15INK4b, p53, OCT4, and NANOG in TDO- and CON-BMSCs at the passages 6, 7, and 8. (G) Western blots of p16INK4a, OCT4, and NANOG protein levels; GAPDH served as an internal control. Data were presented as the mean ± S.D. of 3 independent experiments. *p < 0.05; **p < 0.01.

