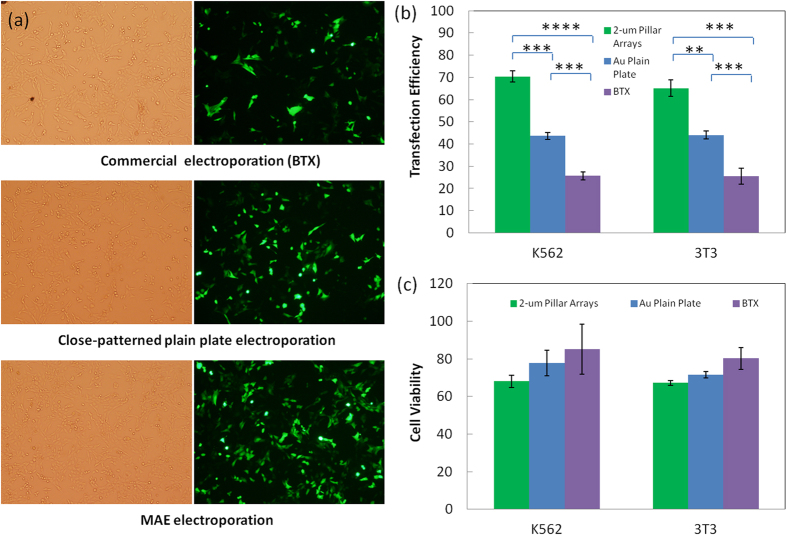
Figure 2. Transfection enhancement of pGFP plasmids in 2-μm micropillar MAE.
(a) Phase contrast and fluorescence microscopic images of NIH 3T3 cells after transfection by a commercial system (“BTX”), “Au plain plate”, and MAE; quantitative results of transfection efficiency (b) and cell viability (c) for 3T3 cells and K562 cells, respectively. n = 6 with (**) represents p < 0.01, (***) represents p < 0.005, (****) represents p < 0.0001.

