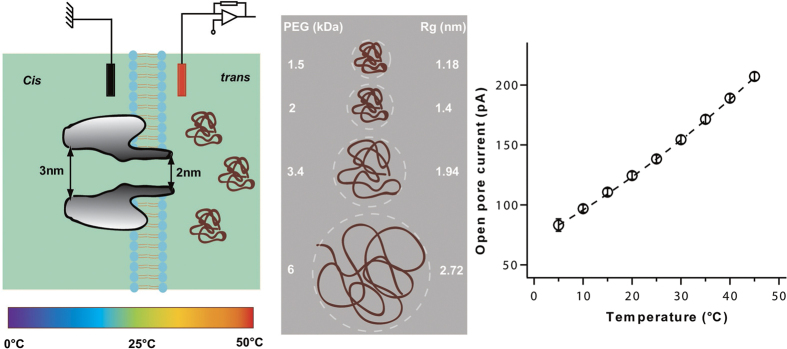
Figure 1.
(Left) Schematic of the experimental set-up used to probe the interaction of PEGs of different molar masses with the α-hemolysin nanopore at different temperatures. (Center) Different molar masses of PEG used and their corresponding calculated sizes. Rg is the gyration radius of a coiled chain calculated assuming good solvent conditions53 and by considering the PEG monomer size equal to 0.35 nm54. (Right) Open pore current at +50 mV versus temperature. Data points are average values of more than 10 experiments with different temperature sequences (hot-to-cold or cold-to-hot) in order to exclude any evaporation effect. Error bars are of the same size or smaller than the symbols. The dashed line follows the variation of the buffer bulk conductance with temperature (2%/°C, see text).

