
Figure 3. Foxo3 is required for Eomes expression in CD4+ T cells.
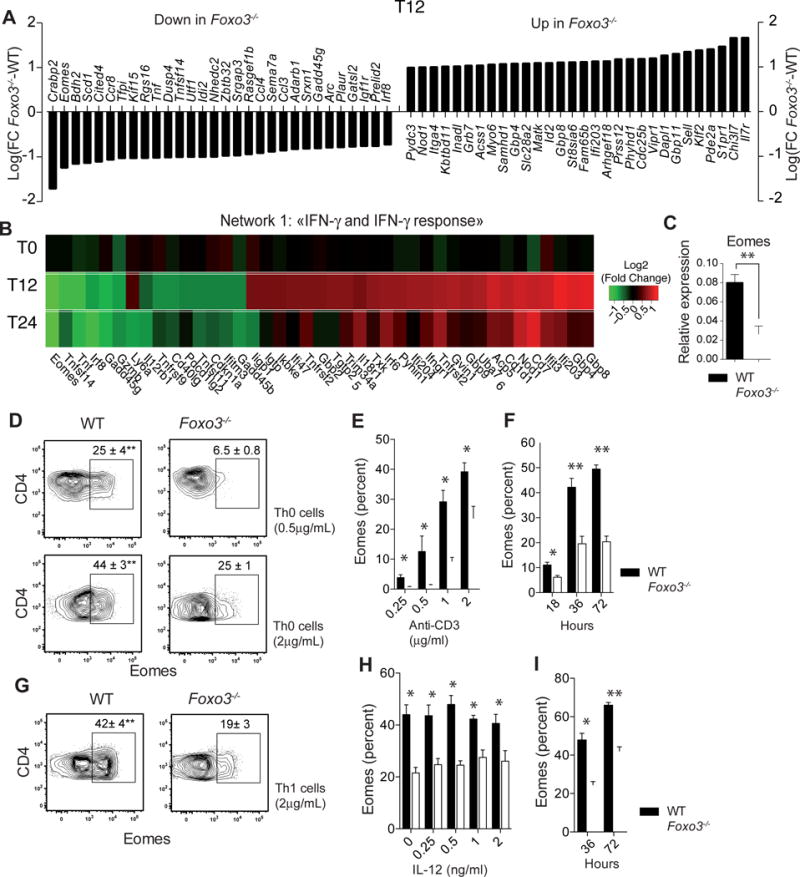
(A) Gene expression microarray experiments comparing WT (n=4) versus Foxo3−/− (n=4) CD4+ T cells after 12h of stimulation in neutral condition with 2 μg/mL of anti-CD3 mAbs. Data are expressed as Log2(Fold Change Foxo3−/−-WT) of the top 30 most significantly regulated genes (FDR ≤ 0.05 and fold change >2 or <2). (B) Gene expression fold changes (Log2(FC Foxo3−/−-WT) of the top most significantly regulated (FDR ≤ 0.05 and fold change > 1.5) genes within the “IFN-γ and IFN-γ response” pathway shown as a Heatmap of over-(red) or under-(green) expressed genes in naive Foxo3−/− CD4+ T cells unstimulated (T0) or stimulated with anti-CD3 mAbs for 12 (T12) or 24 hours (T24) (C) WT (black bars) or Foxo3−/− (open bars) naive CD4+ T cells were stimulated under non-polarizing conditions for 18 hours with 2 μg/mL anti-CD3 mAbs and the mRNA expression of Eomes gene was measured by quantitative real-time RT-PCR (n=4 mice per genotype). (D) Intracellular staining of Eomes expressed by WT or Foxo3−/− naive CD4+ T cells stimulated with 0.5 or 2 μg/mL anti-CD3 in Th0 cell polarizing condition. (E) Frequency of Eomes+ CD4+ T cells in WT (black bars) of Foxo3−/− (open bars) naive CD4+ T cells stimulated under neutral polarizing condition with indicated doses of anti-CD3 mAbs or (F) with 2 μg/mL of anti-CD3 mAbs for the indicated time (n=4 mice per genotype) (G) Eomes expressed by naive CD4+ T cells from WT (black bars) or Foxo3−/− mice (open bars) stimulated with 2 μg/mL of anti-CD3 mAbs under Th1 cell polarizing condition (n=4 mice per genotype) (H) Frequency of Eomes+ CD4+ T cells in WT (black bars) or Foxo3−/− (open bars) naive CD4+ T stimulated with 2 μg/mL of anti-CD3 mAbs and IL-12 (n=4 mice per genotype) for 36 hours or (I) with 2 μg/mL of anti-CD3 mAbs and IL-12 for 36 or 72 hours (n=4 mice per genotype). Data are representative of at least three independent experiments. Error bars, SEM.; P values (Mann–Whitney U test). See also Figure S4