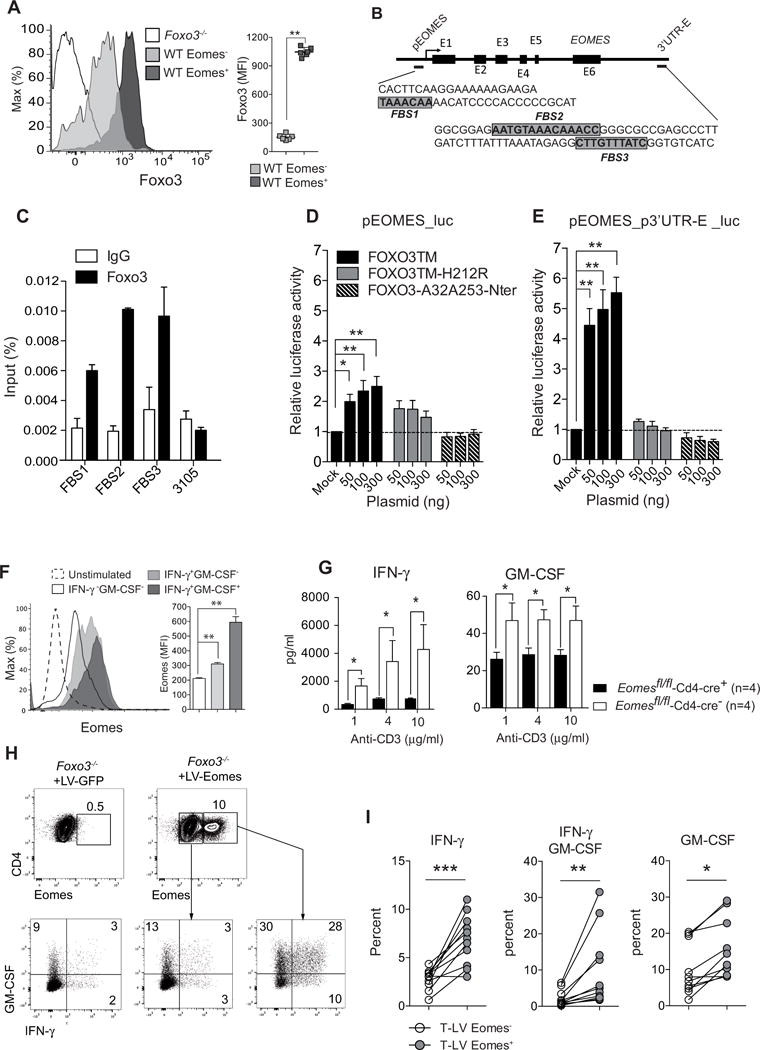
Figure 4. Eomes is a direct target gene of Foxo3.

(A) Foxo3 expression gated on Eomes+ (dark gray) and Eomes− (light gray) WT CD4+ T cells stimulated with 2μg/mL of anti-CD3 mAbs (n=6–7 mice per genotype) (B) Schematic structure of the EOMES gene, the arrow represents transcriptional start site of a gene, the black boxes represent exon position (E1 to E6), the positions and sequences of the putative Forkhead-binding sites (FBS) are represented in highlighted in grey. (C) Chromatin immunoprecipitation analysis of Foxo3 binding to the Eomes locus in purified CD4+ T cells stimulated for 24h with 2μg/mL anti-CD3 mAbs. Results are expressed as percentage of input. (D) HEK293 T cells were co-transfected with reporter plasmids containing the human promoter region of EOMES cloned into the pGL3-Basic vector (pEOMES_luc) or (E) plasmids containing the human promoter region of EOMES with the 3′UTR region containing the 2 putative FBS (pEOMES-p3′UTR-E_luc) together with plasmids coding for different forms of FOXO3: the constitutively active FOXO3a mutant (FOXO3TM, black bars), the constitutively active FOXO3TM mutated for the DNA binding domain (FOXO3TM-H212R, grey bars), the constitutive active FOXO3TM deleted for the transactivation domain (FOXO3-A32A253-Nter, dashed bars) or empty vector (Mock). All luciferase activities were normalized to the expression of the co-transfected Renilla luciferase. (F) Eomes expression gated on IFN-γ−GM-CSF− or IFNγ+GM-CSF− and IFN-γ +GM-CSF+ producing CD4+ T cells stimulated with 2 μg/mL anti-CD3 mAbs under non-polarizing condition. (n=5 mice per genotype). (G) Naive CD4+ T cells purified from Eomesfl/fl-Cd4-cre+ (black bars) or Eomesfl/fl-Cd4-cre− (open bars) were stimulated with anti-CD3 mAbs and the secretion of IFN-γ and GM-CSF was analyzed by ELISA in the supernatant after 3 days of culture (n=4 mice per genotype). (H) IFN-γ and GM-CSF expression in naive Foxo3−/− CD4+ T cells transduced with lentiviral particles expressing the GFP alone (LV-GFP) or Eomes and the GFP (LV-Eomes) and gated on either GFP-transduced (LV-GFP left panel), non-transduced (LV-Eomes, middle panel) or Eomes-transduced CD4+ T cells (LV-Eomes, right panel). (I) Frequency of IFN-γ +, IFN-γ +-GM-CSF+ or GM-CSF+ cells among Foxo3−/− CD4+ T cells either non-transduced (LV-Eomes-,open dots) or transduced (LV-Eomes+, grey dots) (n=11 mice, from 3 independent experiments). Data are representative of at least three independent experiments or two independent experiments (C). Error bars, SEM.; P values (Mann–Whitney U test). See also Figure S5
