Figure 3.

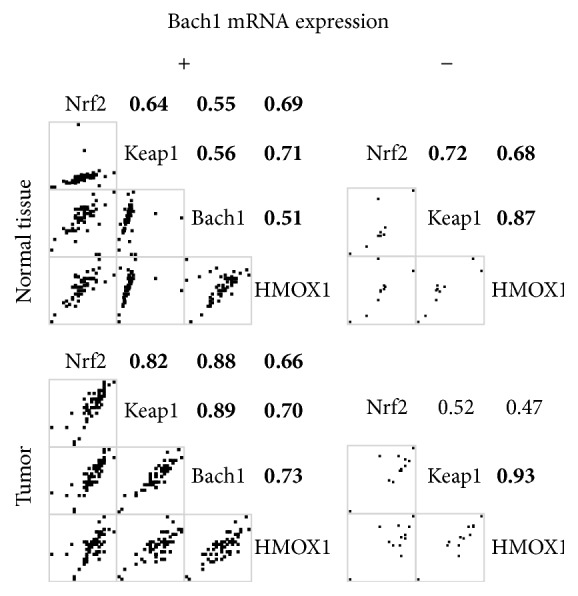
Spearman's correlation coefficients of mRNA levels in the tumor and normal tissues of subjects with or without detectable Bach1 mRNA expression. A bold number denotes a p value less than 0.05.

Spearman's correlation coefficients of mRNA levels in the tumor and normal tissues of subjects with or without detectable Bach1 mRNA expression. A bold number denotes a p value less than 0.05.